The Market Is Looking Expensive

If you are a trader, you don’t care how the market stacks up to past fundamentals.

But, if you are a long-term investor, knowing how the market appears today from a fundamental standpoint, compared to other times, is something you want to keep an eye on.

Knowing when the market is becoming expensive or even overpriced is essential because that tells you it may be time to start taking your foot off the gas. Or the other side of that coin is that the market appears cheap or underpriced.

These times are when the words of Warren Buffett, “Be greedy when others are fearful and fearful when others are greedy,” stand out the most to me.

Buffett is trying to tell investors that when others are buying, despite stocks and the market as a whole being very expensive, you should be concerned. He also says that you should be greedy when others are afraid, likely because of market turmoil and stocks are selling off. Buffett gives you a straightforward, back-of-the-napkin blueprint of when to sell and buy.

With that all said, I don’t believe there are hard-pressed rules on this is when to sell, or this is when to buy.

However, I think now is a time that you should start considering when you will sell or, at the very least, start planning your next moves based on how the market reacts to the coming weeks or months.

One reason I believe we may be hitting a peak is because of general market sentiment. Towards the end of the summer, most market participants, the talking heads on news outlets, and even Wall Street (i.e., the big banks) were saying a recession was very likely in 2023.

However, the market was rallying during that time, then we peaked in August and finally sold off in September. During the fall, the markets were mostly flat, and then things spiked in January. Now the thinking is we may not hit a recession, and inflation may be behind us. Is the market feeling like it could be getting greedy?

But what about the complex data showing us the markets may be overvalued right now? Continue reading "The Market Is Looking Expensive"

5 Reasons To Still Be Bearish

Please enjoy this updated version of weekly commentary from the Reitmeister Total Return newsletter. Steve Reitmeister is the CEO of StockNews.com and Editor of the Reitmeister Total Return.

Click Here to learn more about Reitmeister Total Return


The recent rally in stocks (SPY) has been impressive. But it is still officially a bear market and there are 5 reasons that bears will not be waving a white flag soon. Lets review why stocks rallied… why they are likely to stall at this level… and the 5 reasons why the bearish argument will likely win the day.

Stocks have been rising nearly unabated for 2 months. A lot of that was because it was easy for stocks to “climb the wall of worry” created by the initial decline into bear market territory.

Meaning that it was fairly easy to find just enough silver linings or things not going as bad as advertised for stocks to bounce from that recent bottom. However, as we are finding out now… all good things must end.

Meaning that investors finally found resistance at the 200 day moving average of the S&P 500 (SPY) at 4,326 and retreated quickly from that mark into the finish line on Tuesday. Expect this level to denote the near term highs for the market as we likely enter a consolidation period with trading range to follow.

Why? And what is the parameters of this trading range? And what will cause us to break out of the range?

Market Commentary

Technically speaking… we are still in a bear market. That certainly is confusing to many investors given several weeks of upward price action. So let me spell it out for y’all.

The definition of a bull market is when you come out of a bear market and have risen 20% from the bottom. Well the recent bottom for the S&P 500 (SPY) is 3,636.87 and yet yesterday we closed at 4,305.20 which is 18.38% above the lows. Continue reading "5 Reasons To Still Be Bearish"

Worst First-Half Since 1970 - Time To Capitalize?

This has been the stock market’s worst first-half in over 50 years with inflation serving as the main culprit and a slew of ancillary pressures from China’s Covid lockdowns and the Ukraine/Russia conflict.

Through the first six months, no sector has been immune from the breath and reach of this bear market. The S&P 500, Nasdaq and Russell 2000 are well in bear market territory at June’s end.

Risk appetite across the spectrum has been eroded. The crypto market has collapsed, traditional IPOs and SPACs have dried up and several commodities have collapsed as of late.

Despite this massive wealth destruction, strategists from major Wall Street firms are forecasting that stocks will recapture most of their losses in the back half of the year.

The S&P 500 is expected to finish the year more than 20% higher from the end of June’s levels per the average year-end target derived from the top 15 Wall Street strategists. This forecast translates into the market recapturing most of the year’s losses, albeit finishing the year with a negative return of ~3%.

Deploying Capital

During bear markets or an extended period of a market-wide bear backdrop, investors have the unique opportunity to purchase heavily discounted stocks at a fraction of the price when compared to their peaks.

As history indicates, establishing long-term positions during corrections can lead to outsized gains over the intermediate and long term. As the selling pressure abates and the macroeconomic backdrop resolves, building equity stakes in high-quality companies bodes well for long term investors.

As the macro issues resolve over time, the markets will regain their footing and appreciate higher. The current market backdrop is the exact scenario where investors should be deploying cash on-hand to snap up heavily discounted merchandise in a diversified and dollar cost averaging manner.

Behind the Inflation Curve

The Federal Reserve has fallen far behind the inflation curve, putting through reactive interest rate hikes of 1.5 percentage points, with more to come throughout 2022.

Many politicians and executives have been sounding the inflation alarm since Q4 of 2021 to no avail while the Fed continued to buy bonds and pump liquidity into the system.

The latest inflation numbers by the Labor Department came in at 8.6%, the highest since December 1981. The reactionary Fed and runaway inflation have caused havoc on Wall Street while the Fed attempts to slam the breaks on the economy.

Second Half Bounce?

Although the first half of this year ranks among the worst in history, the selling may ease in the second half if history is any guide.

When the S&P 500 plunged 21% in the first half of 1970, it promptly reversed those losses to gain 26.5% in the second half and post a slight gain for the year. 1932, 1940, 1962 and 1970 saw first half decimation on par with 2022 however every one of those years saw a second half rebound.

Only one year saw the market recover the losses it incurred during the first half, in 1970 (Figure 1).
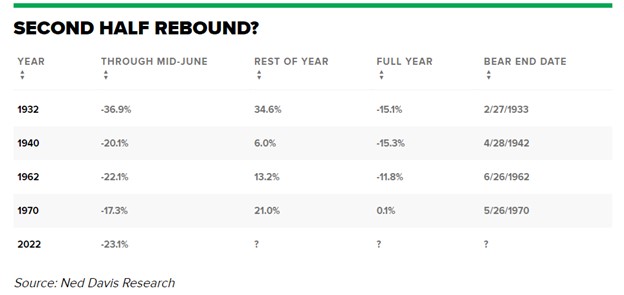
Figure 1

Figure 1 – Historical perspective of worst first half market performances and the respective full year outcomes when factoring in the second half of the year

Recession Possibility and Type

With the possibility of recession, there’s different underpinnings of a bear market that are broken out into cyclical-driven, structural-driven and “event-driven” stock declines of 20% or more.

Goldman Sachs (GS) holds the position that investors are experiencing a cyclical bear market which is marked by high inflation and rising interest rates. This combination results in price-to-earnings multiple contraction and thus a reduction in valuations.

The current climate is buffered against a structural bear market that is buoyed by strong corporate and household balance sheets. The positive side is that the average cyclical bear market lasts two years, far shorter than the average three in half years for a structural bear market. The average price decline during a cyclical bear market is only about 31% versus 57% during a structural one per Goldman.

Cash On-Hand

Deploying cash into an environment where the selling is relentless and indiscriminate can be a daunting task. However, for any portfolio structure, having cash on-hand is essential and in these environments is where this cash should be deployed in equities.

This cash position provides investors with flexibility and agility when faced with market corrections. Cash enables investors to be opportunistic and capitalize on stocks that have sold off and have become de-risked.

Initiating new positions and dollar cost averaging during these extended periods of weakness are great long-term drivers of portfolio appreciation. Absent of any systemic risk, there’s a lot of fantastic entry points for many high-quality large cap companies. Investors should not remiss and capitalize on this buying opportunity because it may not last too long.

Anchoring and Dollar Cost Averaging

Purchasing stocks at the exact bottom is nearly impossible however purchasing stocks at attractive valuations in a disciplined manner over time is possible.

Dollar cost averaging is a great strategy to use when anchoring down into a position with an initial sum of capital and following through with additional incremental purchases as the stock declines further. The net benefit is reducing the average purchase price per share in a sequential fashion (i.e., reducing cost basis). An example of building out a high-quality portfolio with subsequent dollar cost averaging throughput this market weakness can be seen in Figure 2.
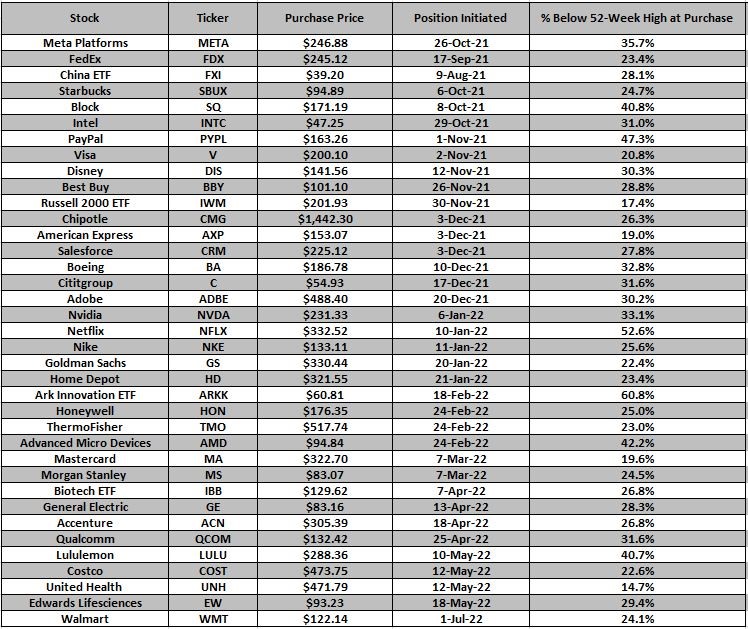
Figure 2

Figure 2 – Initiating positions in high quality companies with subsequent dollar cost averaging to build out a well-diversified portfolio. These long equity trades along with options-based trades can be found via the Trade Notification service.

Conclusion

This has been the stock market’s worst first-half in over 50 years where no sector has been immune from the breath and reach of this bear market. The S&P 500, Nasdaq and Russell 2000 are well in bear market territory at June’s end.

Despite this massive wealth destruction, strategists from major Wall Street firms are forecasting that stocks will recapture most of their losses in the back half of the year. The S&P 500 is expected to finish the year more than 20% higher from the end of June’s levels per top Wall Street strategists.

Purchasing stocks at the exact bottom is nearly impossible however purchasing stocks at attractive valuations in a disciplined manner over time is possible. During bear markets, investors have the unique opportunity to purchase heavily discounted stocks at a fraction of the price when compared to their peaks.

As history indicates, establishing long-term positions during corrections can lead to outsized gains over the intermediate and long term. As the selling pressure abates and the macroeconomic backdrop resolves, building equity stakes in high-quality companies bodes well for investors. The current market backdrop is the exact scenario where investors should be deploying cash on-hand to snap up heavily discounted merchandise.

Noah Kiedrowski
INO.com Contributor

Disclosure: Stock Options Dad LLC is a Registered Investment Adviser (RIA) firm specializing in options-based services and education. There are no business relationships with any companies mentioned in this article. This article reflects the opinions of the RIA. Any recommendation contained in this article is subject to change at any time. No recommendation is intended to constitute an entire portfolio. The author encourages all investors to conduct their own research and due diligence prior to investing or taking any actions in options trading. Please feel free to comment and provide feedback; the author values all responses. The author is the founder and Managing Member of Stock Options Dad LLC – A Registered Investment Adviser (RIA) firm www.stockoptionsdad.com defining risk, leveraging a minimal amount of capital and maximizing return on investment. For more engaging, short-duration options-based content, visit Stock Options Dad LLC’s YouTube channel. Please direct all inquires to

in**@st*************.com


. The author holds shares of AAPL, ACN, ADBE, AMD, AMZN, ARKK, AXP, BA, BBY, C, CMG, COST, CRM, DIA, DIS, EW, FB, FDX, FXI, GOOGL, GS, HD, HON, IBB, INTC, IWM, JPM, LULU, MA, MS, MSFT, NKE, NVDA, PYPL, QCOM, QQQ, SBUX, SPY, SQ, TMO, UNH and V.

Stocks are NOT Out of the Woods

I get the distinct feeling that a lot of investors are feeling like the action last week in the equity markets may be a harbinger of good things to come. In other words, we might be out of the woods.

As much as I’d like to believe that I can’t jump on board. I still feel there’s more downside pain to come for stocks, tech, and other risky assets like Bitcoin (BTC) and crypto. But before I tell you why, let’s take a win, no matter how ugly it is.

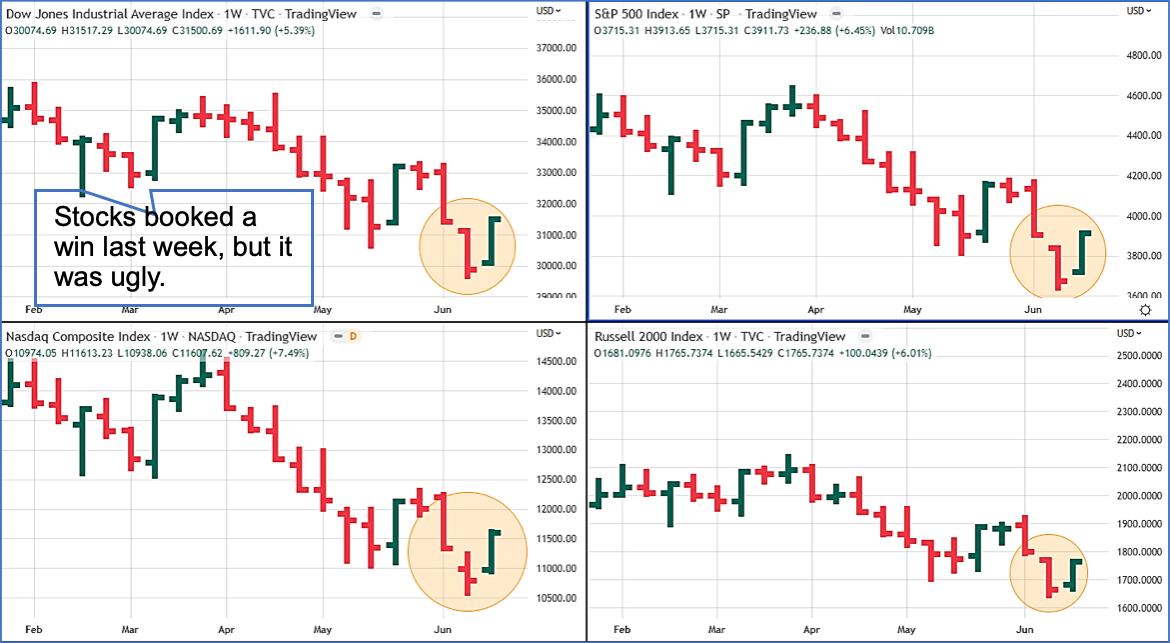
Fact is, across the board last week equity markets were up. See for yourself…

Weekly Charts

Source

As you can see from this collection of multiple weekly charts, stocks booked a win last week. The Dow was up 5.4% and the S&P 500 - a good proxy for the broader stock market - was up 6.4%. Meanwhile, the Russell 2000 - a good gauge of all stocks - was up 6%. And probably most surprising of all, the tech-heavy Nasdaq was up 7.5%.

In addition, last week’s action in all four the indexes reversed multi-week slides. It was the first positive week in four weeks for the Dow, the S&P, and the Nasdaq. For the Russell 2000 it was the first up week in the last three weeks.

But as you can see from the above charts, last week’s action was an anomaly compared to the action we’ve been seeing over the recent past. In fact, if you take the above charts and drill out to what’s been happening over the past year, it’s clear the overall trend in all these markets is bearish. No ifs, ands, or buts.

As I warned about in my article at the beginning of June, the scant positive weekly action in these markets is now confirmed as little more than a series of “dead cat bounces.”

If you remember, a dead cat bounce can masquerade as a reversal to the upside. But it’s only a temporary reprieve and quickly resumes its prior downtrend. Unfortunately, that’s what we’ve been seeing in all these stocks markets. And while I’d love to be wrong on this point, the numbers don’t lie.

Stubborn Inflation Means More Downside

But it’s not just these technical patterns that tell me the markets have more downside pain to come. The other huge factor pressuring stock prices: Inflation and what it will take to bring it under control. Here’s what I mean.

In general inflation can drive investors to sell stocks. And that because inflation wears away at the value of invested dollars. If your money is worth 8.6% less this year that it was last year, nobody is happy.

But the biggest reason inflation drives investors to sell stocks is that that the “medicine” that’s needed to bring inflation down - higher interest rates - can have unpleasant side effects.

Fact is if higher rates do their jobs and bring prices down, companies have less money to do the things that investors want, like sell more goods, expand operations, and develop new products. And if companies aren’t doing what investors want, those investors sell their shares.

Result: A bear market like we’re seeing right now.

But as unpleasant as that is, not bringing inflation down is much, much worse. In fact, inflation can decimate entire economies. The last thing we want is to look in the rear-view mirror and see the current inflation rate of 8.6% as “the good old days.”

That’s why as unpleasant as the side effects of higher interest rates can be, the Fed must do everything in its power to get inflation under control. But don’t take my word for it: Here’s what Fed chairman Jerome Powell told Congress last week in his testimony and semiannual monetary policy report:

I will begin with one overarching message. At the Fed, we understand the hardship high inflation is causing. We are strongly committed to bringing inflation back down, and we are moving expeditiously to do so. We have both the tools we need and the resolve it will take to restore price stability on behalf of American families and businesses. It is essential that we bring inflation down if we are to have a sustained period of strong labor market conditions that benefit all. Source

So far, so good. What exactly are they going to do about it?

Over coming months, we will be looking for compelling evidence that inflation is moving down, consistent with inflation returning to 2 percent. We anticipate that ongoing rate increases will be appropriate; the pace of those changes will continue to depend on the incoming data and the evolving outlook for the economy. We will make our decisions meeting by meeting, and we will continue to communicate our thinking as clearly as possible. Our overarching focus is using our tools to bring inflation back down to our 2 percent goal and to keep longer-term inflation expectations well anchored. Source

So, what does this tell me? With benchmark target fed funds rate now at a range of 1.5% to 1.75%, it’s clear that that’s just the beginning. More interest rate increases are coming. In fact, I think the Fed won’t slow down until it hits 3.5% and higher.

In addition, I now think the Fed is willing to take on a higher risk of recession in exchange for lower inflation. In fact, during his testimony Powell said that a recession could be in the cards: “It’s not our intended outcome at all, but it’s certainly a possibility … we are not trying to provoke and do not think we will need to provoke a recession, but we do think it’s absolutely essential” that prices come down. Source

Here's What to Do

There’s no doubt about it: Until inflation gets under control, rates will continue to go up. The Fed is making it clear that they’re going to do everything in their power to control rising prices.

And that means that there’s likely more downside to stocks as well as other risky assets like Bitcoin (BTC) and other cryptocurrencies. So, I wouldn’t be adding to any positions right now. And as always, don’t devote any more than 1% to 2% of your portfolio to crypto of any kind, including BTC.

Stay safe,
Wayne Burritt
INO.com Contributor

Disclosure: This contributor may own cryptocurrencies, stocks, or other assets mentioned in this article. This article is the opinion of the contributor themselves. The above is a matter of opinion provided for general information purposes only and is not intended as investment advice. This contributor is not receiving compensation (other than from INO.com) for their opinion.

Window of Opportunity - Valuations Below Pre-Pandemic Highs

Window of Opportunity

Six months of relentless and indiscriminate selling has roiled the markets. This selling has reduced the frothy pandemic induced run-up in stocks back to pre-pandemic levels. In many cases stocks are trading well below the pre-pandemic highs.

Stocks are now presenting a window of opportunity for long-term investors at this juncture. With the collective P/E ratios reverting to its historical mean, oversold conditions at extremes and the inflation picture at a potential inflection point may combine to be a back half of the year reprieve.

This window of opportunity may not last too much longer based on historical bear market metrics so pounce and pounce harder if the markets slide further.

Mid-June Flushing?

Many commentators in the investing circles stated that a final washout in the market was likely needed prior to moving higher in any meaningful way.

Mid-June saw its worst weekly performance since March of 2020, dropping 5.8% for the S&P 500 while taking its overall decline to ~24%. After this brutal week, there hasn’t been any stock or sector that has been immune to the breadth of participation in this sell-off. As such, the market has now registered abnormal extremes in selling and oversold conditions.

Is this the washout that was needed to arrest the selling pressures in this market, and will this be an inflection point? A battery of indicators suggest that the markets are close to making a meaningful move higher very soon.

Inflection Point?

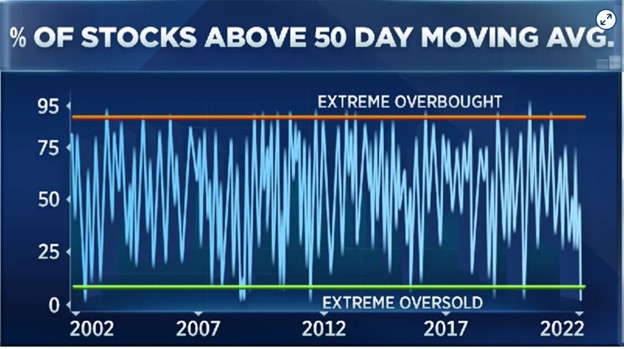
The percentage of S&P 500 stocks trading above their 50-day average hit a level that can’t go any lower as seen over the past 20 years. This level indicates extremely oversold conditions (Figure 1).  

% Stocks Above 50-Day Moving Average

Figure 1 – Assessing overbought and oversold conditions via the percent of stocks relative to its 50 day moving average (adopted from CNBC).

It’s noteworthy to highlight that fewer than 25% of stocks are still within 20% of their 52-week high. The only times this was worse was the Covid crash and the 2007-2009 financial crisis. Over 42% of S&P 500 stocks hit a new 52-week low, only the tenth time since 1985 this total exceeded 40%.

The average Nasdaq stock has undergone a 50% drop from its high. The S&P 500 now trades at a level first reached more than 16 months ago in early 2021. This move negates the post-Covid advance in equity markets. The correction waves in February 2016 and December 2018 both bottomed at levels first reached nearly two years prior. Thus, these markets are reaching the point where the past two years of appreciation has been erased.

Stocks Are Looking Cheap

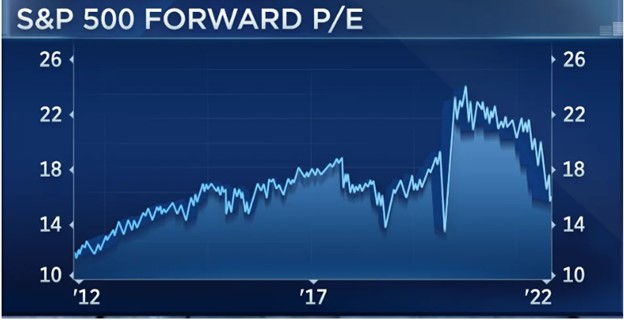
The current collective P/E a ~16, well off the pre-Covid high and not far above where it has bottomed in prior severe sell-offs in 2016, 2018 and 2020 closer to a P/E of ~14. The equal-weight S&P 500 finished mid-June at 13.1-times earnings. It’s noteworthy to point out that the markets bottomed in December 2018 at 12.9 and in March 2020 at 11 (Figure 2).  

SP500 Forward P/E

Figure 2 – Assessing P/E ratios over the past 10 years (adopted from CNBC).

Conclusion

The relentless and indiscriminate selling has reduced the frothy pandemic induced run-up in stocks back to pre-pandemic levels. Stocks are now presenting a window of opportunity for long-term investors at this juncture.

With the collective P/E ratios reverting to its historical mean, oversold conditions at extremes and the inflation picture at a potential inflection point may combine to be a back half of the year reprieve.

The percentage of S&P 500 stocks trading above their 50-day average hit a level that can’t go any lower as measured relative to the past 20 years. This level indicates extremely oversold conditions.

Fewer than 25% of stocks are still within 20% of their 52-week high. The only times this was worse was the Covid crash and the 2007-2009 financial crisis. Over 42% of S&P 500 stocks hit a new 52-week low, only the tenth time since 1985 this total exceeded 40%. The average Nasdaq stock has undergone a 50% drop from its high.

Bank of America’s Bull & Bear Indicator, which captures fund flows and other market-based risk-appetite measures, is well in the fearful depths that typically imply a buying opportunity. During prolonged stressed periods (i.e., 2000-’02 and 2008-’09) bear markets had this gauge persistently stuck at these low levels while prices continued to trend lower.

This window of opportunity may not last too much longer based on historical bear market metrics so pounce and pounce harder if the markets slide further.

Noah Kiedrowski
INO.com Contributor

Disclosure: Stock Options Dad LLC is a Registered Investment Adviser (RIA) firm specializing in options-based services and education. There are no business relationships with any companies mentioned in this article. This article reflects the opinions of the RIA. Any recommendation contained in this article is subject to change at any time. No recommendation is intended to constitute an entire portfolio. The author encourages all investors to conduct their own research and due diligence prior to investing or taking any actions in options trading. Please feel free to comment and provide feedback; the author values all responses. The author is the founder and Managing Member of Stock Options Dad LLC – A Registered Investment Adviser (RIA) firm www.stockoptionsdad.com defining risk, leveraging a minimal amount of capital and maximizing return on investment. For more engaging, short-duration options-based content, visit Stock Options Dad LLC’s YouTube channel. Please direct all inquires to

in**@st*************.com


. The author holds shares of AAPL, ACN, ADBE, AMD, AMZN, ARKK, AXP, BA, BBY, C, CMG, CRM, DIA, DIS, FB, FDX, FXI, GOOGL, GS, HD, HON, IBB, INTC, IWM, JPM, MA, MS, MSFT, NKE, NVDA, PYPL, QCOM, QQQ, SBUX, SPY, SQ, TMO, and V.