Window of Opportunity
Six months of relentless and indiscriminate selling has roiled the markets. This selling has reduced the frothy pandemic induced run-up in stocks back to pre-pandemic levels. In many cases stocks are trading well below the pre-pandemic highs.
Stocks are now presenting a window of opportunity for long-term investors at this juncture. With the collective P/E ratios reverting to its historical mean, oversold conditions at extremes and the inflation picture at a potential inflection point may combine to be a back half of the year reprieve.
This window of opportunity may not last too much longer based on historical bear market metrics so pounce and pounce harder if the markets slide further.
Mid-June Flushing?
Many commentators in the investing circles stated that a final washout in the market was likely needed prior to moving higher in any meaningful way.
Mid-June saw its worst weekly performance since March of 2020, dropping 5.8% for the S&P 500 while taking its overall decline to ~24%. After this brutal week, there hasn’t been any stock or sector that has been immune to the breadth of participation in this sell-off. As such, the market has now registered abnormal extremes in selling and oversold conditions.
Is this the washout that was needed to arrest the selling pressures in this market, and will this be an inflection point? A battery of indicators suggest that the markets are close to making a meaningful move higher very soon.
Inflection Point?
The percentage of S&P 500 stocks trading above their 50-day average hit a level that can’t go any lower as seen over the past 20 years. This level indicates extremely oversold conditions (Figure 1).
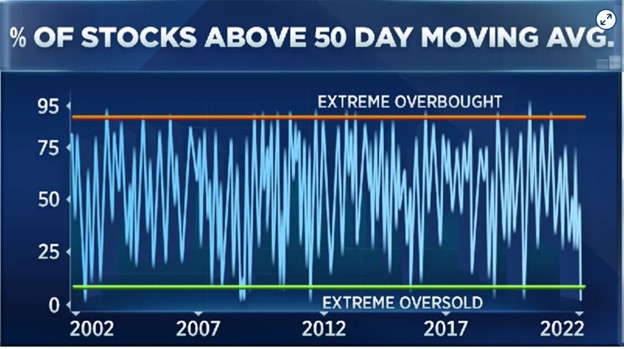
Figure 1 – Assessing overbought and oversold conditions via the percent of stocks relative to its 50 day moving average (adopted from CNBC).
It’s noteworthy to highlight that fewer than 25% of stocks are still within 20% of their 52-week high. The only times this was worse was the Covid crash and the 2007-2009 financial crisis. Over 42% of S&P 500 stocks hit a new 52-week low, only the tenth time since 1985 this total exceeded 40%.
The average Nasdaq stock has undergone a 50% drop from its high. The S&P 500 now trades at a level first reached more than 16 months ago in early 2021. This move negates the post-Covid advance in equity markets. The correction waves in February 2016 and December 2018 both bottomed at levels first reached nearly two years prior. Thus, these markets are reaching the point where the past two years of appreciation has been erased.
Stocks Are Looking Cheap
The current collective P/E a ~16, well off the pre-Covid high and not far above where it has bottomed in prior severe sell-offs in 2016, 2018 and 2020 closer to a P/E of ~14. The equal-weight S&P 500 finished mid-June at 13.1-times earnings. It’s noteworthy to point out that the markets bottomed in December 2018 at 12.9 and in March 2020 at 11 (Figure 2).
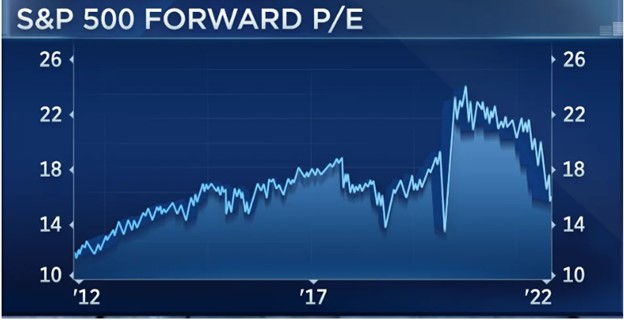
Figure 2 – Assessing P/E ratios over the past 10 years (adopted from CNBC).
Conclusion
The relentless and indiscriminate selling has reduced the frothy pandemic induced run-up in stocks back to pre-pandemic levels. Stocks are now presenting a window of opportunity for long-term investors at this juncture.
With the collective P/E ratios reverting to its historical mean, oversold conditions at extremes and the inflation picture at a potential inflection point may combine to be a back half of the year reprieve.
The percentage of S&P 500 stocks trading above their 50-day average hit a level that can’t go any lower as measured relative to the past 20 years. This level indicates extremely oversold conditions.
Fewer than 25% of stocks are still within 20% of their 52-week high. The only times this was worse was the Covid crash and the 2007-2009 financial crisis. Over 42% of S&P 500 stocks hit a new 52-week low, only the tenth time since 1985 this total exceeded 40%. The average Nasdaq stock has undergone a 50% drop from its high.
Bank of America’s Bull & Bear Indicator, which captures fund flows and other market-based risk-appetite measures, is well in the fearful depths that typically imply a buying opportunity. During prolonged stressed periods (i.e., 2000-’02 and 2008-’09) bear markets had this gauge persistently stuck at these low levels while prices continued to trend lower.
This window of opportunity may not last too much longer based on historical bear market metrics so pounce and pounce harder if the markets slide further.
Noah Kiedrowski
INO.com Contributor
Disclosure: Stock Options Dad LLC is a Registered Investment Adviser (RIA) firm specializing in options-based services and education. There are no business relationships with any companies mentioned in this article. This article reflects the opinions of the RIA. Any recommendation contained in this article is subject to change at any time. No recommendation is intended to constitute an entire portfolio. The author encourages all investors to conduct their own research and due diligence prior to investing or taking any actions in options trading. Please feel free to comment and provide feedback; the author values all responses. The author is the founder and Managing Member of Stock Options Dad LLC – A Registered Investment Adviser (RIA) firm www.stockoptionsdad.com defining risk, leveraging a minimal amount of capital and maximizing return on investment. For more engaging, short-duration options-based content, visit Stock Options Dad LLC’s YouTube channel. Please direct all inquires to
in**@st*************.com
. The author holds shares of AAPL, ACN, ADBE, AMD, AMZN, ARKK, AXP, BA, BBY, C, CMG, CRM, DIA, DIS, FB, FDX, FXI, GOOGL, GS, HD, HON, IBB, INTC, IWM, JPM, MA, MS, MSFT, NKE, NVDA, PYPL, QCOM, QQQ, SBUX, SPY, SQ, TMO, and V.