Bitcoin, Dollar, Gold And Silver Update

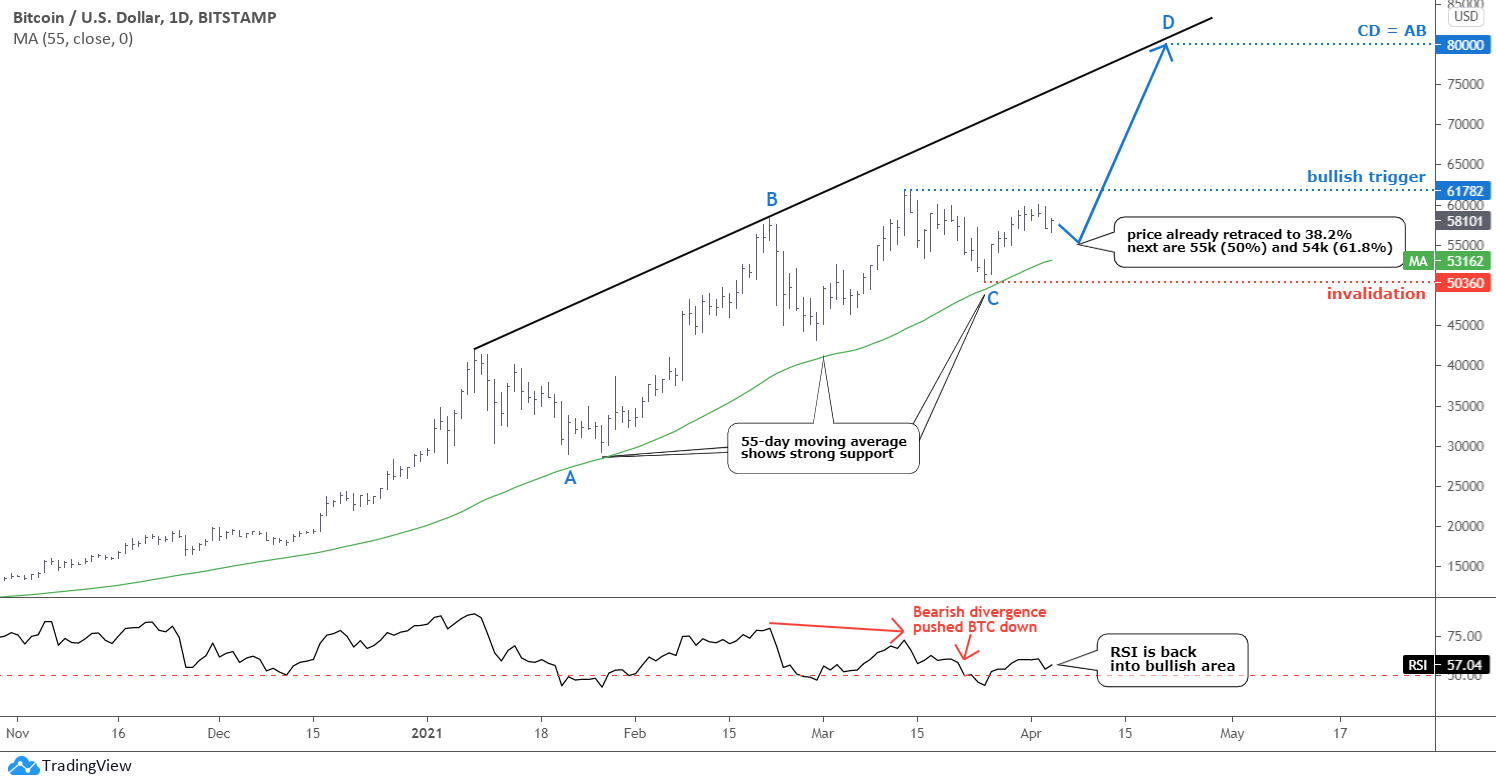
As Bitcoin matures, the chart structure becomes more readable over time. We can see how such a conventional indicator as a moving average perfectly supports the price. I added a 55-day (Fibonacci number) moving average (green), which at least three times this year kept the price in the bullish mode that started last October when the price crossed this line to the upside.

Another popular indicator RSI has perfectly detected the Bearish Divergence and pushed the price down last month. After that, it moved back above the crucial 50 level, which supported the current upward move.

Daily Bitcoin Chart

I see possible AB/CD segments in the chart (blue labels). The BC consolidation was huge and complicated, but it could be over now. If the CD segment travels the same distance as the AB part, then the price of Bitcoin could hit the new all-time high of $80,000. The projection of the black trendline resistance confirms that ambitious target, and we know how powerful the trends are. Continue reading "Bitcoin, Dollar, Gold And Silver Update"

Weekly Stock Market Forecast

This week we have a stock market forecast for the week of 4/04/21 from our friend Bo Yoder of the Market Forecasting Academy. Be sure to leave a comment and let us know what you think!

The S&P 500 (SPY)

SPY Daily Chart - Stock Market Forecast

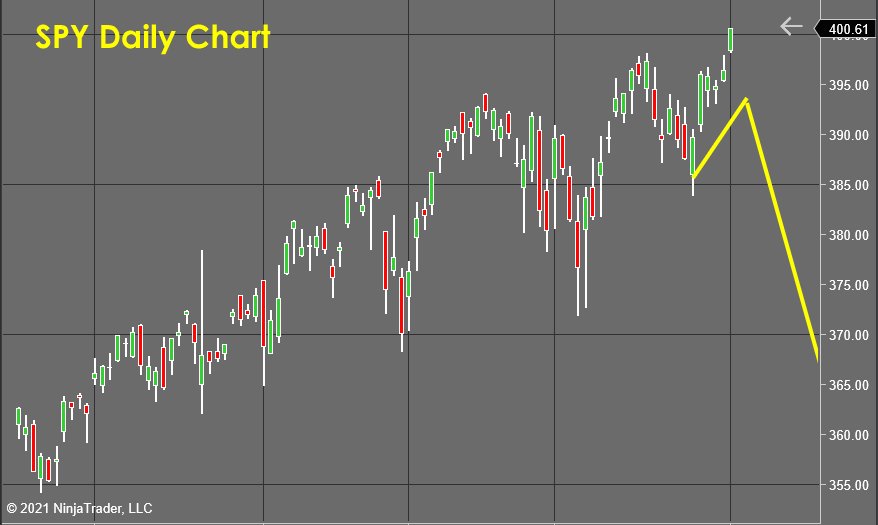
The news of the new infrastructure/stimulus bill caused the market (analyzed here using the SPY) to react with a gap up and run type candlestick. This surge took out the highs since it seems the Fed will accept a period of inflation as all these new print and spend policies work their way through the economy. The Jobs numbers beat expectations as well, and this also pushed stocks higher. However, the buying hasn’t shown to be connected to a new surge in internal bullish energy, so I’m still expecting to see a topping process begin soon.

With this new upthrust in prices, the head and shoulder pattern I was forecasting for this week has invalidated itself, and I’ll wait to see what profit-taking pressures show up next week before figuring out if this breakout is just simply the head of a NEW head and shoulders formation. Continue reading "Weekly Stock Market Forecast"

Gold: What A Long And Not So Strange Trip

The Gold Miner correction was well earned, but it was not a bubble.

Even today there is some pablum out there talking about how if inflation is good for gold it is especially good for gold miners. I will simply repeat once again that if gold usually does not benefit fundamentally by cyclical inflation (i.e. inflation promoted for and currently working toward economic goals) the gold miners never do, unless they rise against their preferred fundamentals as they did during two separate phases in the last bull market, which were justly resolved with crashes.

Here are a couple charts we used in NFTRH 648 in a segment written to set the record straight. We have also used these charts – especially the first one – since the caution flags went up last summer, visually by the first chart and anecdotally by the usual suspects aggressively pumping the unwitting masses. Buffett buys a gold stock!… okay, well so much for that. Sentiment became off the charts over-bullish and now, as we prepare for the final act of the correction, it’s the opposite. That’s perfect.

HUI had far exceeded the Gold/SPX ratio and so it was very vulnerable from a macro fundamental perspective. Why on earth would players want to focus on miners digging a rock out of the ground that was starting to fail in a price ratio to the stock market? They wouldn’t, and since last summer they didn’t.

Gold

But from a sector fundamental perspective the Gold/Oil ratio (Oil/Energy is a primary driver of mining costs) and HUI show that the 2020 rally was nothing like the two bubbles of yesteryear, when not only did HUI hit danger signals (!) noted above by a macro fundamental indicator, it also made two separate bubbles vs. this sector fundamental. This time? Nope, no bubble here. Continue reading "Gold: What A Long And Not So Strange Trip"

Weekly Stock Market Forecast

This week we have a stock market forecast for the week of 3/27/21 from our friend Bo Yoder of the Market Forecasting Academy. Be sure to leave a comment and let us know what you think!

The S&P 500 (SPY)

SPY Daily Chart - Stock Market Forecast

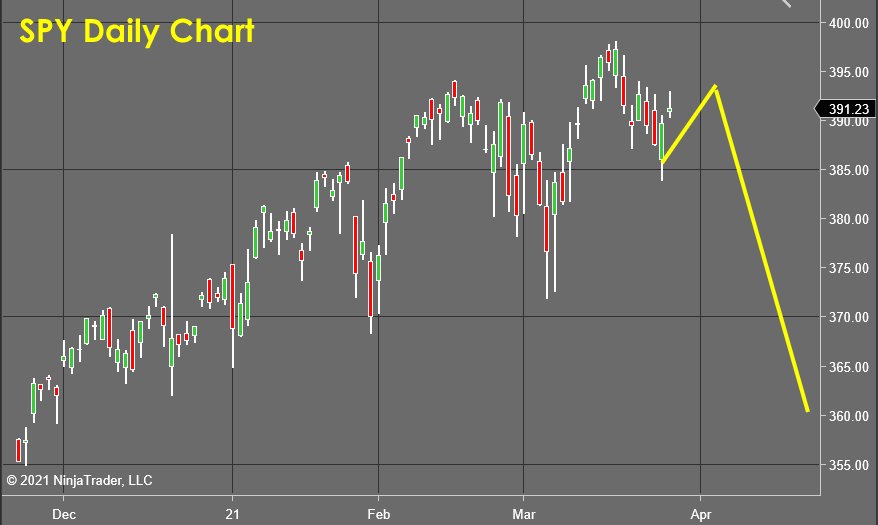
Not a lot has changed in my forecast since last week… I believe the S&P 500 (analyzed here using the ETF SPY) is working its way through a possible head and shoulders reversal pattern on the daily chart. This is a very well understood and recognized reversal pattern and would thus attract a lot of profit-taking activity which I’m expecting to turn the market sharply lower.

For those who are more visual, my forecast for the S&P can be best understood by looking at the yellow lines on the attached chart. The bounce I forecasted last week appeared on schedule and is driving the price up for what I believe will be a failed rally ending as a lower high. Continue reading "Weekly Stock Market Forecast"

Gold & Silver: Dollar Is Going Down

U.S. dollar index (DXY) 4-hour chart

Dollar Index

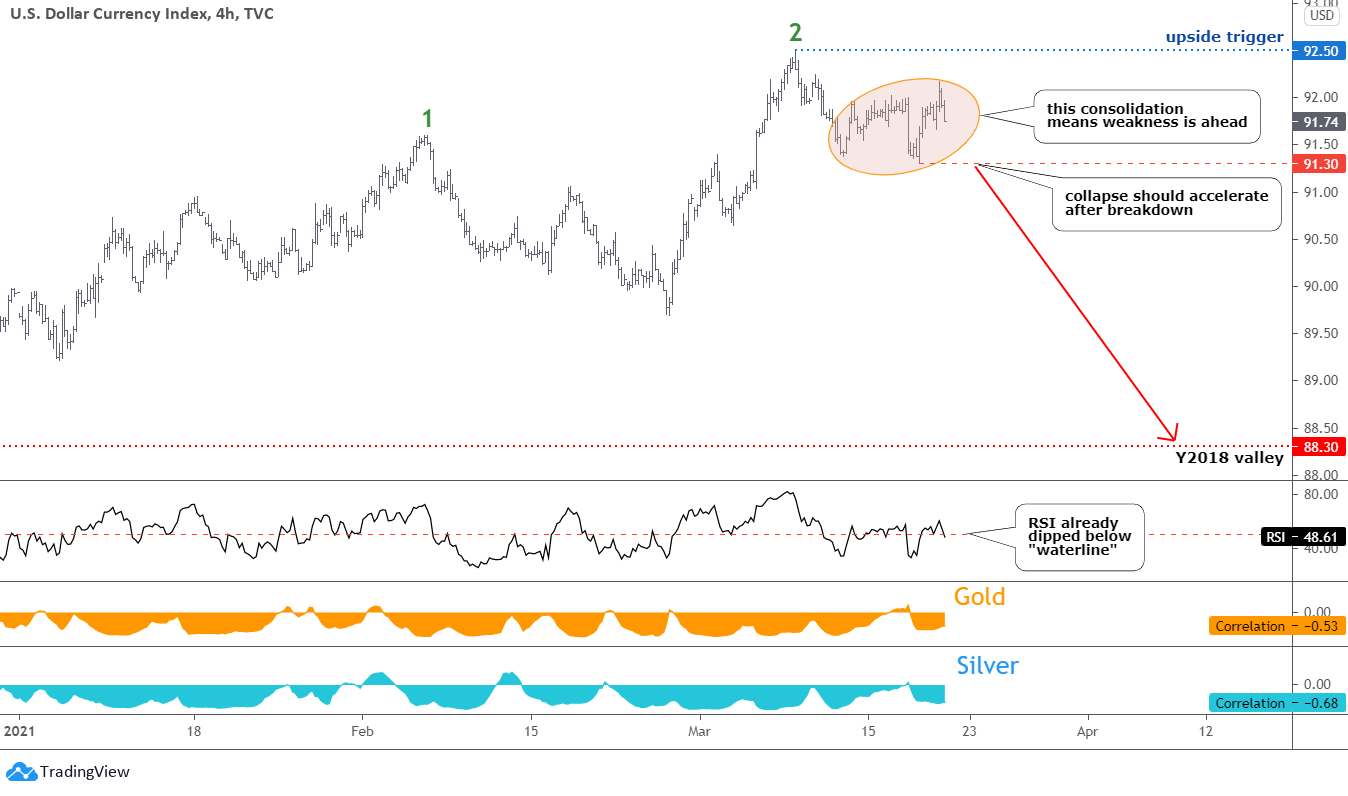
Last time the chart structure of the dollar was less clear; hence I put two opposite scenarios in the chart with triggers.

As time goes by, the market reveals itself more clearly. The DXY price built a familiar two-leg consolidation highlighted with the orange ellipse. It follows the preceding move down from the recent peak of green leg 2. It means further weakness is ahead. I put the trigger on the 91.30 mark (bottom of the minor consolidation) for confirmation. The target remains intact in the area of the Y2018 valley. Continue reading "Gold & Silver: Dollar Is Going Down"