Metals Moving In Unison For A Massive Price Advance: Part 1

Are the metals markets ending a price correction in unison and preparing for a massive price advance? This is the question we asked our research team to investigate and their findings may help skilled traders identify great opportunities in the future. This multi-part research article will share our most recent opinion about the metals markets as well as share some critical new data that can shed some light into what we believe will become a massive upside price rally in the metals markets. Let’s get into the data.

When one considers the global demand for Gold as a hedge against economic crisis events and the continued advancement in gold reserves for China and Russia, one has to consider the supply side issues that are a result of central banks global demand. Even though global production of Gold is near an all-time high, the demand from foreign nations and central banks are also near all-time highs. This correlation creates a demand-side consumption that offsets supply and, in some ways limits, consumer, retail and technology suppliers.

Our researchers focused on this aspect of the supply/demand equation when trying to analyze recent metals price action in correlation to disruptions that could occur in the markets. For example, increased central bank buying/hoarding of gold could dramatically result in prices spiking. Foreign market disruptions in supply could also send prices spiking. Global conflicts and or continued trade issues could send metals prices skyrocketing. Anything to do with the supply side for Gold could send prices higher. At least this is the conclusion of our research team at this time. Continue reading "Metals Moving In Unison For A Massive Price Advance: Part 1"

Will Oil Find Support Near $60?

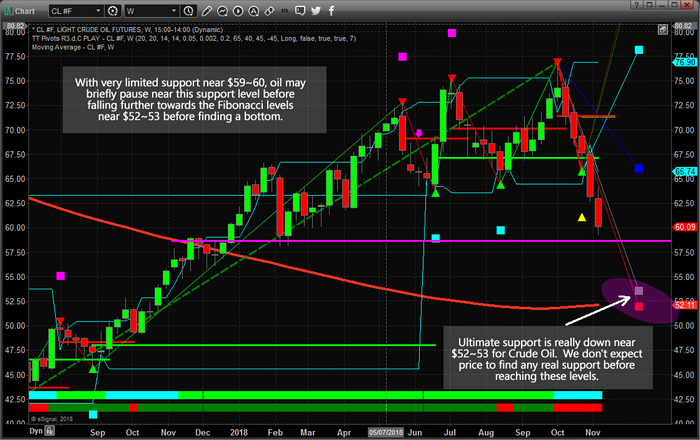
Our research team warned of this move in Crude Oil back on October 7, 2018. At that time, we cautioned that Oil may follow a historical price pattern, moving dramatically lower and that lows near $65 may become the ultimate bottom for that move. Here we are with a price below that level, and many are asking “where will it go from here?”.

We believe the support near $65, although clearly broken, may eventually become resistance for a future upside price move. Our proprietary Fibonacci price modeling system is suggesting a new target near $52~53, and we believe this downside move in Oil is far from over at this point.

global climate

The current global climate for Oil is that suppliers are pumping more and more oil into the market at a time when, historically, prices should continue to decline. One of our research tools includes the ability to identify overall bias models for each week, month or quarter. Traditionally, Oil is dramatically weaker in November and relatively flat for December. Continue reading "Will Oil Find Support Near $60?"

Bearish Pattern Warns Of Dollar Weakness

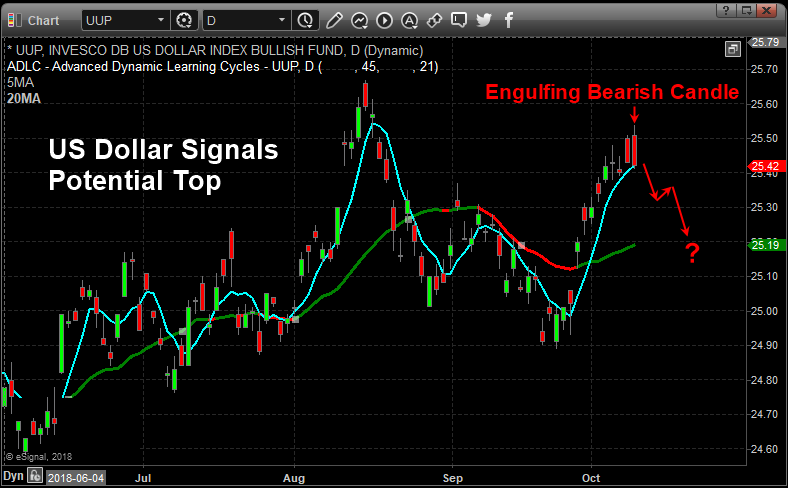
A unique setup has occurred in the Invesco DB US Dollar Index (UUP) that resembles an Engulfing Bearish type of pattern (even though it is not technically an Engulfing Bearish pattern). Technically, an Engulfing Bearish pattern should consist of a green candle followed by a larger red candle whereas the red candle’s body (the open to close range) completely engulfs the previous candle’s body. In the instance, we are highlighting in this article, a unique variation of what we’ll call a “Completely Filled Engulfing Bearish” pattern is setting up.

This is when two red candles set up in an Engulfing Bearish type of formation – omitting the requirement that the first candle is green. Japanese Candlesticks help us to identify the psychology of the market price in relation to our other specialized tools. We believe this formation is important because both of the red candlesticks that make up this pattern opened much higher than the previous bar’s close and dramatically sold off into the close of each session. We believe this type of rotation clearly illustrated that price is reaching resistance near $25.50 and pushing lower because of this strong resistance. We also believe this resistance/pattern will set up a downside price move in the US Dollar very soon.

bearish pattern

Below, we have highlighted the traditional formation of an Engulfing Bearish Candlestick pattern. The example chart, to the right of this definition, shows another variation of the Engulfing Bearish pattern setting up after three minor sideways candles. The interpretation of this Bearish Reversal pattern is subjective in terms of understanding the psychological representation of the Engulfing Bearish pattern. This pattern represents a total reversal of power within the price bar where the buyers were in control at the open (resulting in a higher opening price) and lost control through the trading session to allow the sellers to drive the price much lower into the close of the trading session. Thus, the Engulfing Bearish pattern represents a “key pivot point” in price that may prompt a larger downside move in the near future. Continue reading "Bearish Pattern Warns Of Dollar Weakness"

Are Technology And FANG Stocks Bottoming?

Recent downside pricing pressure on Technology and FANG stocks have kept investors wary of jumping back into the market while we wait to see where the bottom may form. Concerns about long-term pricing pressures, US trade wars and the continued Congressional testimony regarding privacy and censorship issues have kept social media technology stocks in a negative perspective. The only aspect of this pricing pullback that is positive is that these stocks will, at some point, find a price bottom and attempt to rally as investors rush back into their favorites attempting to ride the run higher.

Our researchers believe the current price levels could be a prime example of a short-term bottom setting up in certain technology stocks. Both Apple and Amazon are two of the biggest and most actively traded stocks on the US Stock exchange. They differ from many of the other FANG stocks because these companies actually produce and sell consumer products & services that are, in many ways, essential to conducting commerce and trade.

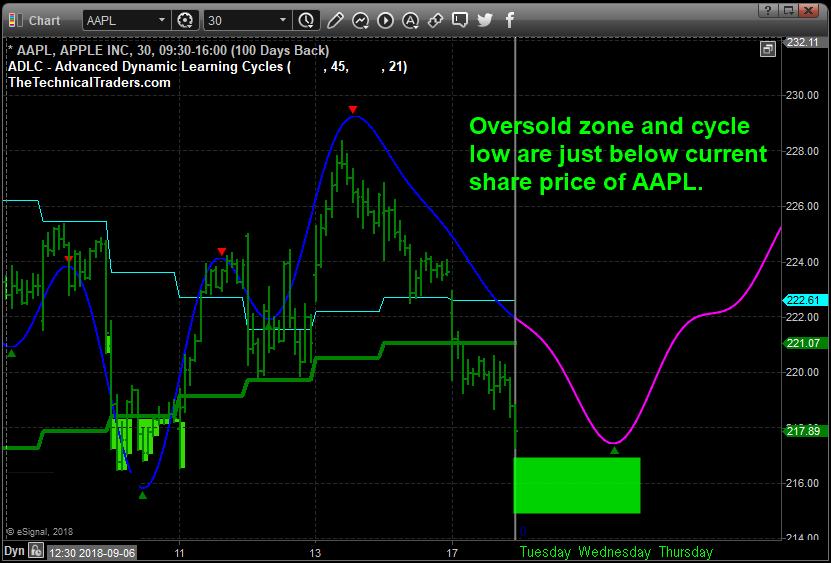
This 30-minute chart of Apple shows our Adaptive Dynamic Learning Cycles price modeling system showing a cycle low is setting up over the next day or two in Apple followed by an upside price cycle that should push prices back above $220. Notice the oversold levels highlighted in BRIGHT GREEN. The last major oversold levels setup just below $218. The current oversold levels are setting up just below $217. We believe these $217 levels will likely set up a price bottom and prompt an upside price rally over the next 5+ days that could push Apple prices well above $225.

FANG Stocks

Amazon is setting up a different type of price bottoming formation – a Fibonacci price retracement bottom. We use these Fibonacci price retracement levels in conjunction with our other price modeling systems to attempt to determine where and when price reversals may be set up in the future. In this example, we can see a price bottom formed in early August of a Fibonacci 50% price pullback and the current price pullback is testing the same 50% level. We believe this current setup will prompt a price bottom to form and an upside price rally will likely result in AMZN rushing back above $2000 again with a few days. Continue reading "Are Technology And FANG Stocks Bottoming?"

Oil Likely To Find Support In Uptrend

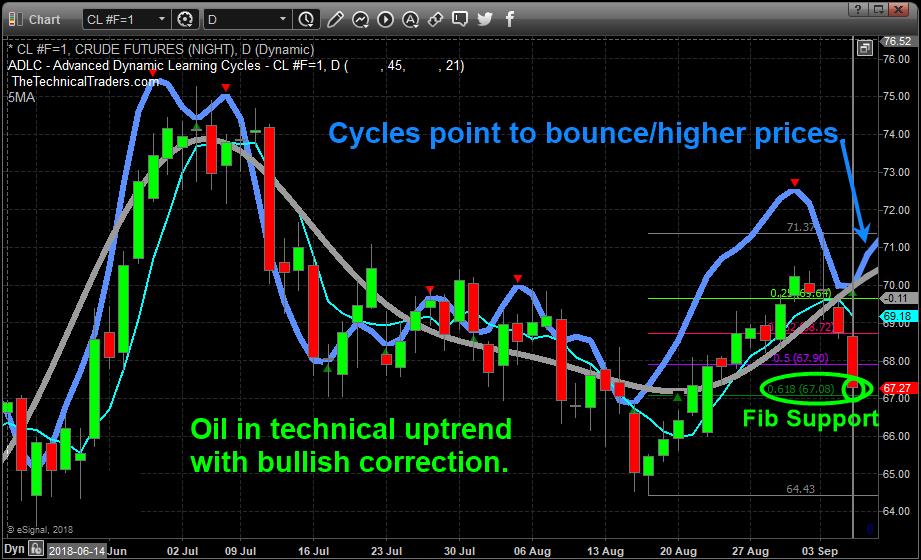
I have focused my attention on the recent price rotation in the Crude Oil market. I believe the recent downside rotation in price, while technically still in a bullish trend, is an excellent opportunity for traders to identify entry positions for a potential price rally to levels near or above $70~71 ppb.

My proprietary price modeling systems and price cycle systems are clearly illustrating that Oil prices should find support, bottom and rotate higher within the next 5~7+ days. I rely on these proprietary indicators and modeling systems to help understand when opportunities exist in the markets. When I can determine that price is moving counter to a primary trend and creating what I call a “price anomaly”, where enhanced opportunity exists for a profitable outcome, I attempt to determine if this trigger warrants alerting our followers. In this case, I believe the opportunity for upside price action following this price rotation is exceptional.

This first chart shows our proprietary price cycle modeling system at work and clearly shows the key Fibonacci support levels that I believe will act as a floor for the price of Oil. I believe a bottom will form near $67 ppb and a new price rally will result in prices moving quickly back above $70 ppb.

crude oil market

This second chart shows the XLE price cycles on a Daily basis and I want to highlight the potential for a price move from near $73 to well above $76 (or higher) if our analysis is correct. This reflects a +4~8% price move that I believe could happen within the next 5~10+ days. Continue reading "Oil Likely To Find Support In Uptrend"