
It is not clickbait for hype. I will take you through my observations in this post to show you why it could play out.
Every market has its stages develop over time: Boom and Bust, Growth and Correction, Collapse and Consolidation. The corrective phase could be around for the stock market.
The main question, as always, is how deep it could drop when a retracement unfolds. This is not an easy one. To see the market from different angles, I built the comparison chart as I put the S&P 500 index itself (black bars), then I added Vanguard Value Index Fund ETF (VTV) (red line) and Vanguard Growth Index Fund ETF (VUG) (blue line).
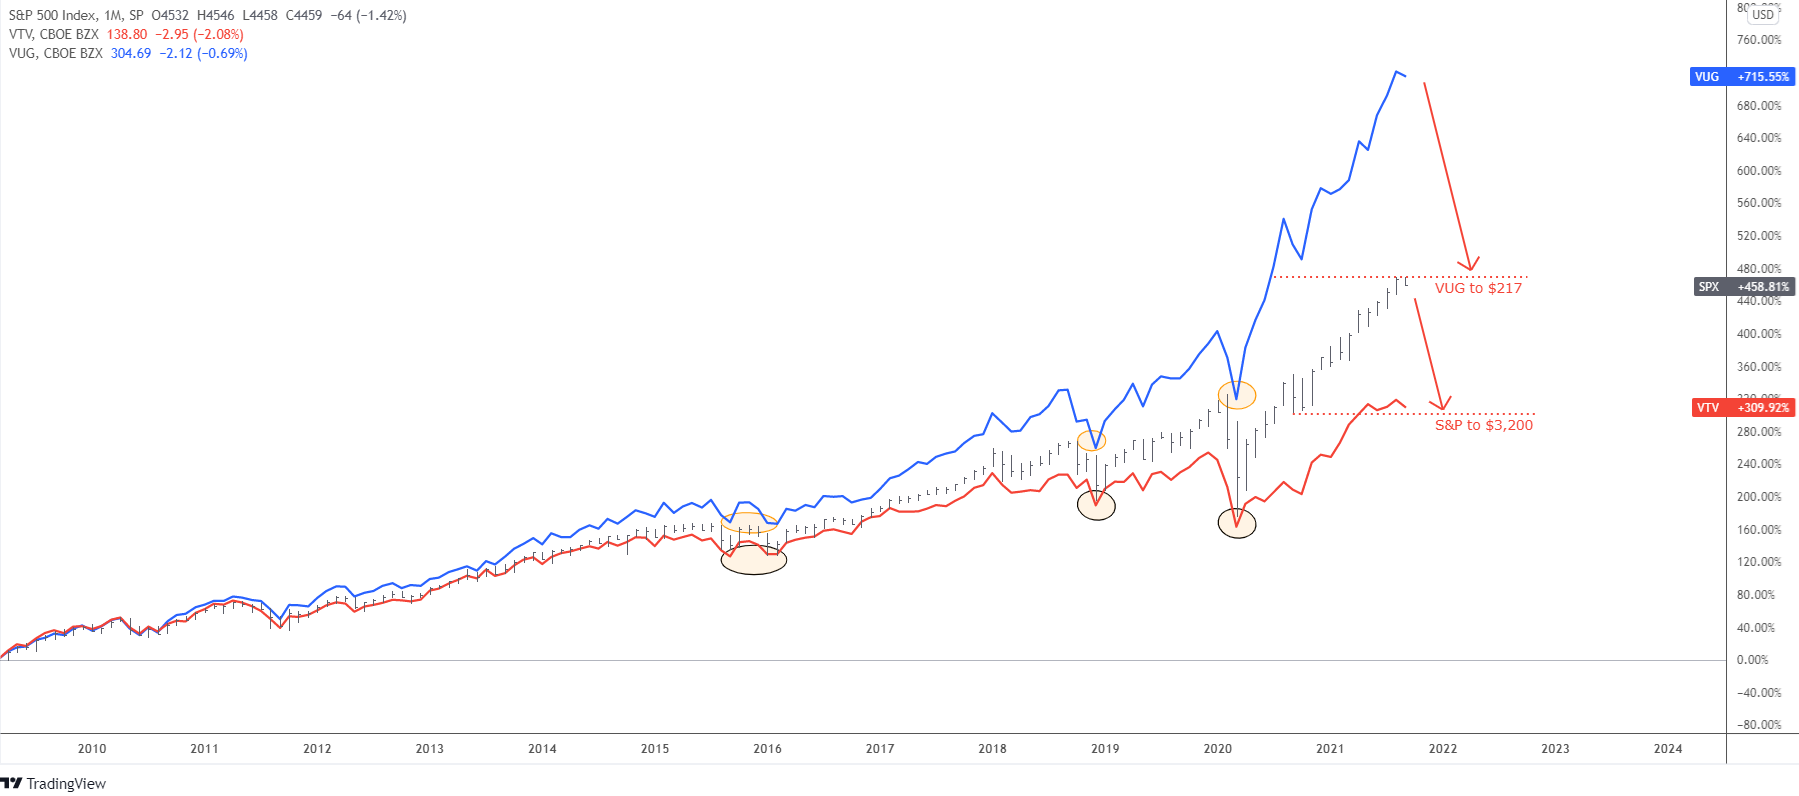
This monthly chart starts from the major bottom in 2009. SINCE THEN, the S&P 500 index has gained more than 450% since then, the value stocks have scored more than 300%, while the growth stocks have made a jaw-dropping 715%. Continue reading "S&P 500 To Lose 30%?"