Crude Oil Closes the Gap

Back in July, I shared with you a chart of Market Distortion where I put together crude oil and platinum futures. I spotted a disruption of a strong correlation pattern between these two instruments that has been lasting for a quarter of a century.

That post drew your attention with strong support and feedback as readers shared their valuable comments. Below is the graph showing the distribution of your opinion on how the divergence would play out.

Ballot Votes

The majority of readers chose the option that implies the equal move in the opposite direction of both instruments to meet somewhere in between - crude oil should drop to $75 and platinum futures should rocket to $1,200. The second largest bet was on the widening gap.

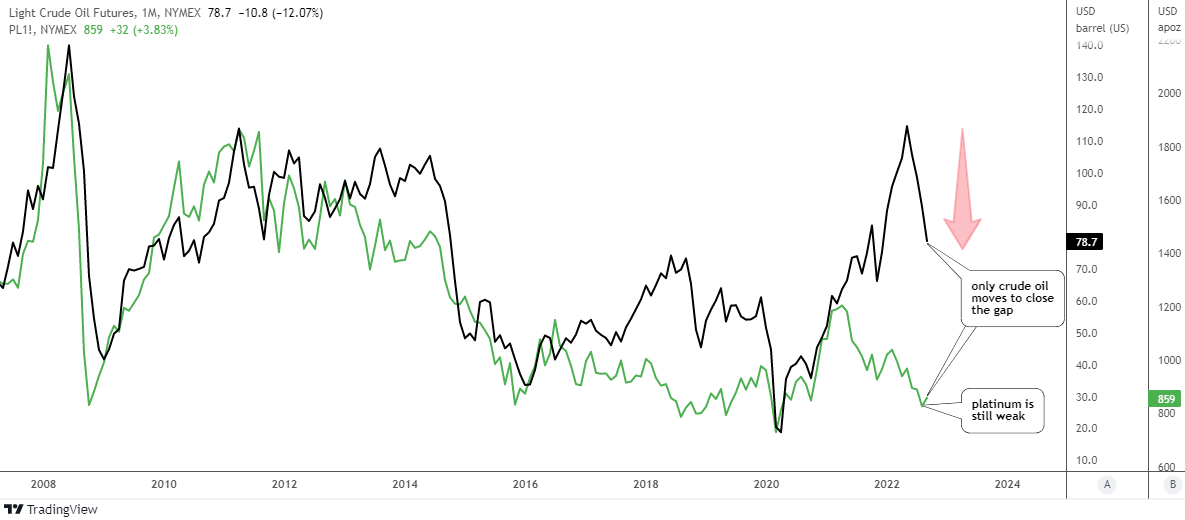
I prepared for you an updated chart below to see what happened after two months.

Oil Futures vs Platinum Futures Monthly

Source: TradingView

None of the bets have hit it right, although your main choice is still the closest. Indeed, the crude oil futures (black line) did its job fully to close the gap as it almost touched the $75 area. The lowest handle hit was $78 so far.

The counterpart, as it often happens in human relationships, did not meet the other part halfway. The platinum (green line) is still weak as it can’t raise its head to the upside.

Should crude oil do the job for both and drop even lower like a rock to catch up with the metal? Or is platinum quietly accumulating power for a rally? Continue reading "Crude Oil Closes the Gap"

Market Distortion: Crude Oil vs Platinum

Market distortions appear from time to time in different instruments and sometimes it offers opportunities. I spotted one of a kind for you in the chart below.
Oil vs Platinum Chart

Source: TradingView

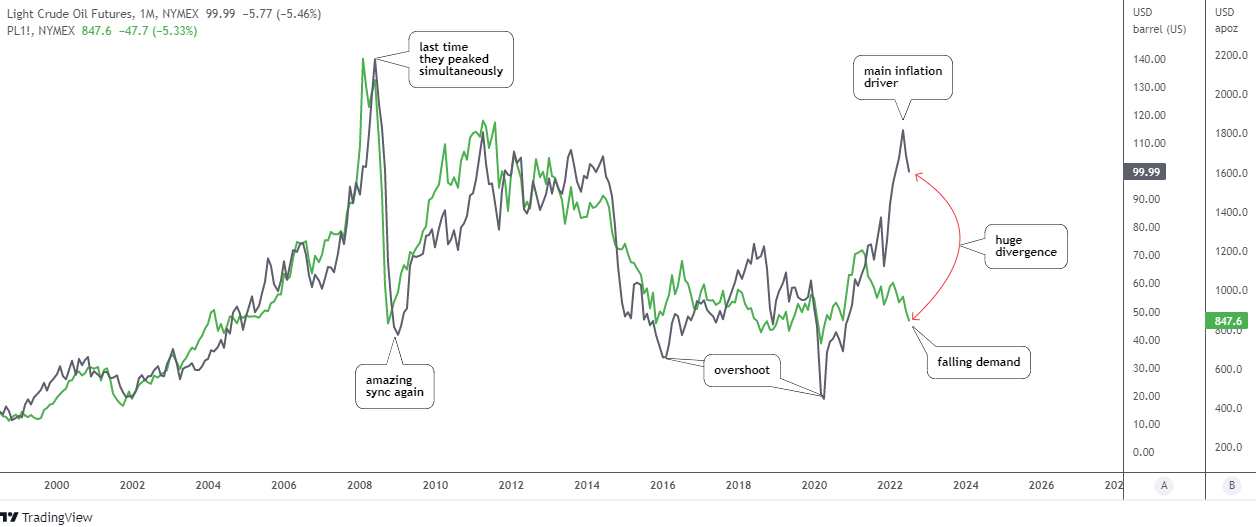
There is a quarter of a century of amazing correlation between crude oil futures (gray, scale A) and platinum futures (green, scale B) in the chart above. The rally and the simultaneous climax in 2008 with the following tremendous collapse into the same valley the same year are the bright spots of that strong sync.

These two instruments have been swapping the leading role as sometimes oil has been showing the path to the platinum and vice versa. The strong rebound in the past financial crisis in 2009, as well as the robust recovery in 2020 has been led by platinum futures.

The long-lasting depreciation period from 2011 till 2020 has several mis-correlation spots and overshoots in the oil price. In 2020, the two instruments have synced again as the platinum price appreciated strongly to levels unseen since 2014 and crude oil was catching up.

Last year something went wrong as the price of the metal could not progress higher after hitting the 6-year top of $1,348 in February 2021. In spite of this, the link remained strong for some time longer.

The oil price has paused its rally making the sharp zigzag in the area of the platinum price peak as if it was “inviting” the metal to continue hand in hand sky high, but in vain. This is when the divergence has started to grow and reached the ultimate gap this year.

What’s next? Possibilities that come to my mind would be a huge drop in oil price down to the $50 area to match with the current platinum level, the strong recovery of the metal’s price to around $1,600 to catch up with the oil price, or the third path would be a compromise, both instruments close the gap equally to meet in between around $75 for crude oil futures and $1,200 for platinum futures.

Every news feed tells us why oil is rising daily. What about the platinum depreciation? Let's check its fundamentals.
Platinum Supply and Demand

Source: Metals Focus, World Platinum Investment Council

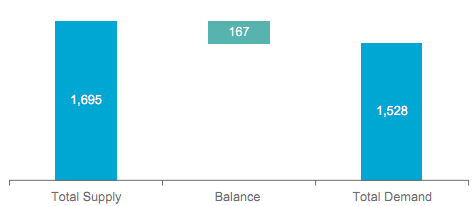
In the first quarter of this year, the platinum market is in the oversupply of 167 thousand oz. Both parts of equilibrium are down, but demand dropped harder.

Platinum Demand

Source: Metals Focus, World Platinum Investment Council

Three of four main components of platinum demand have decreased, especially industrial and investment components. The automotive demand remains flat. Total demand declined 26% (-541 thousand oz.) year-on-year, which is huge and it doesn’t support the metal’s rally.

Let us check the price chart of platinum futures.
Platinum Futures Monthly

Source: TradingView

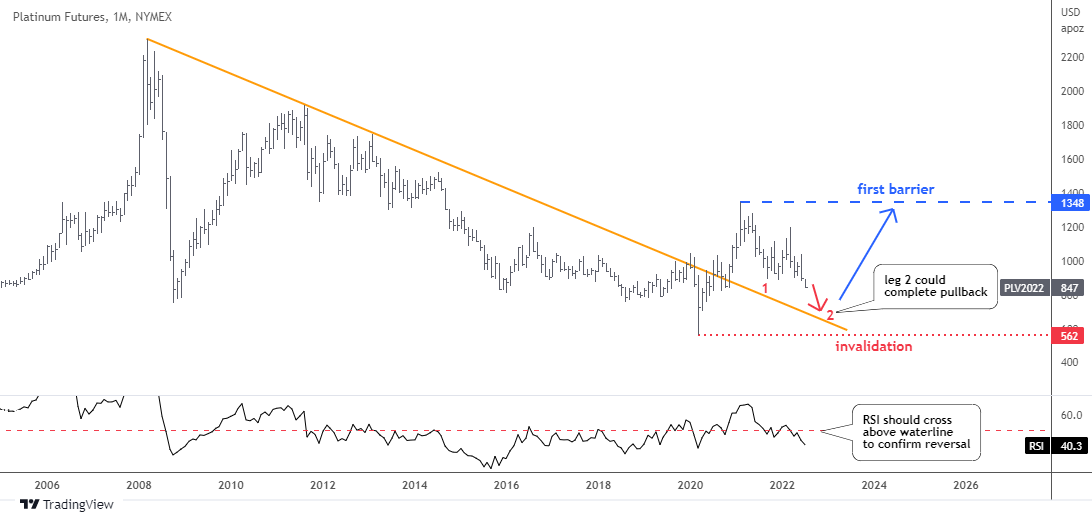
The price of platinum futures moves downwards in the second red leg within a large pullback to retest the broken resistance.

The retracement was already deep enough as it dropped below the 61.8% Fibonacci retracement level. The next support level is located at $730 (78.6% Fib). The touch point of retest is located even lower around $670. Though, the market price has more room for a further weakness.

The price shouldn’t fall below the invalidation level of $562 where the current growth point is located. The first upside barrier is too far now at $1,348 (2021 peak).

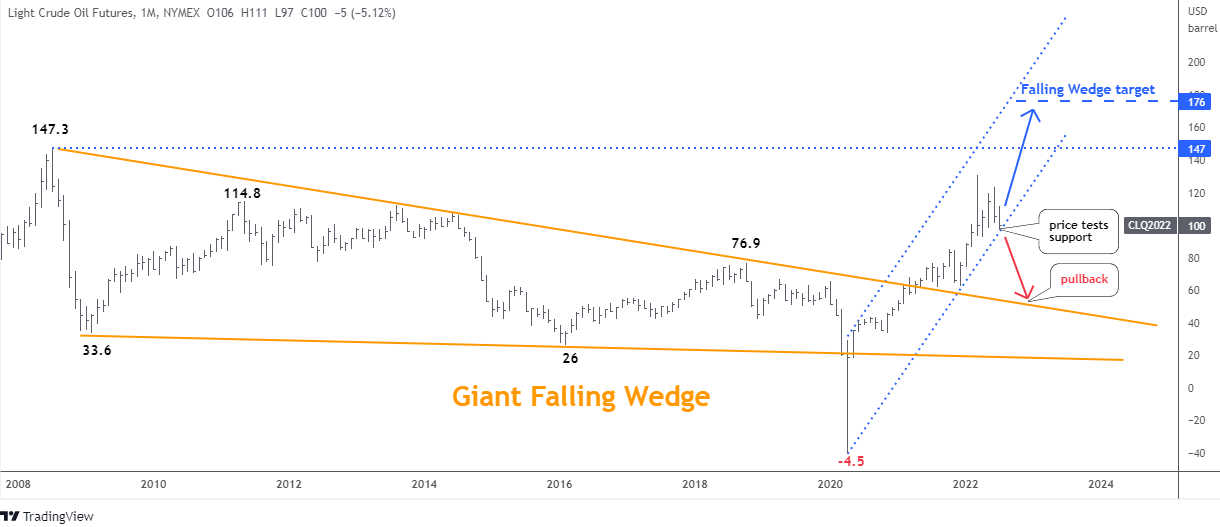
This April I called the oil price to skyrocket to $176. These days, it is not a bold projection anymore as “Global oil prices could reach a “stratospheric” $380 a barrel if US and European penalties prompt Russia to inflict retaliatory crude-output cuts”, JPMorgan Chase & Co. analysts warned.

The updated oil futures chart is below.
Oil Futures Chart

Source: TradingView

The oil price has advanced almost $30 since April, however the previous top of $130 was not touched. There is a retest of the blue uptrend channel support now and the situation could change anytime soon.

The bounce back in the uptrend could fuel the price to retest the all-time high of $147 at least. On the other hand, the breakdown could send the price into a deep pullback to the broken orange resistance around $50.

The latter is the price area where crude oil would close the gap to catch up with platinum according to the first chart above. It is an amazing coincidence of different charts.

How do you think the current divergence between crude oil and platinum will play out?

View Results

Loading ... Loading ...

High energy prices are the main driver of the current persistent inflation. Platinum is an industrial precious metal and its depreciation reflects the falling demand affected by gloomy projections of the economy and the tightening Fed. This combination could result in the stagflation (stagnation + inflation) of the economy.

Intelligent trades!

Aibek Burabayev
INO.com Contributor

Disclosure: This contributor has no positions in any stocks mentioned in this article. This article is the opinion of the contributor themselves. The above is a matter of opinion provided for general information purposes only and is not intended as investment advice. This contributor is not receiving compensation (other than from INO.com) for their opinion.

Has The FED Broken Inflation?

On Tuesday, July 5th, Crude Oil collapsed very sharply, down over 10% near the lows, in an aggressive breakdown of the price. The $97.43 lows reached that day were more than -14% from recent highs (set on June 29, 2022) and more than -21% from highs set on June 14, 2022.

Consumer Discretionary Spending Likely To Fall Further

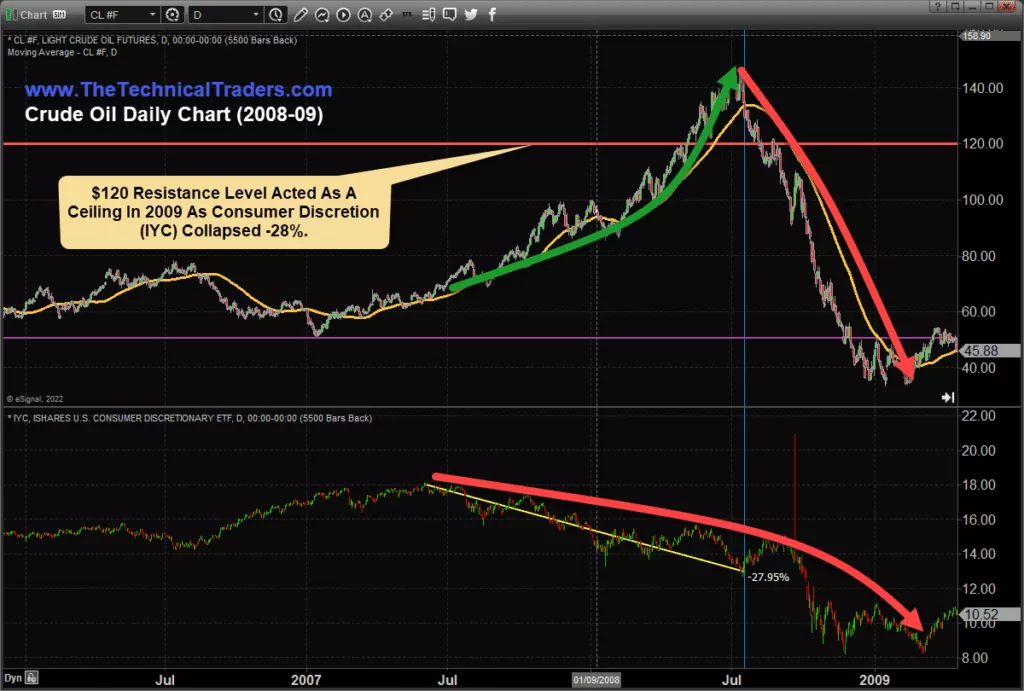
Recently, I shared a similar breakdown that took place in Crude Oil in 2009 and how tightening consumer spending often correlates with peaks in Crude Oil when crisis events happen.

Within that research article, I shared this chart highlighting the collapse in the Consumer Discretionary sector that preceded the downward collapse in Crude Oil. The interesting facet of this chart is we can see the inflationary price pressure in Crude Oil (and the general economy) countered by pressures put on consumers in the lower IYC price chart.

Consumers Lead The Global Economy – Watch IYC Closely

As prices rise, consumers are put under extreme pressure to keep their normal standard of living. As inflationary pressures continue, consumers make necessary sacrifices to manage their budgets – often going into debt in the process.

Eventually, this cycle breaks, and inflationary trends end. This is clearly evident on the chart below in July 2008 – as IYC, the Consumer Discretionary sector, collapsed by more than 27% before Crude Oil finally peaked and broke downward.

Crude Oil Daily Chart

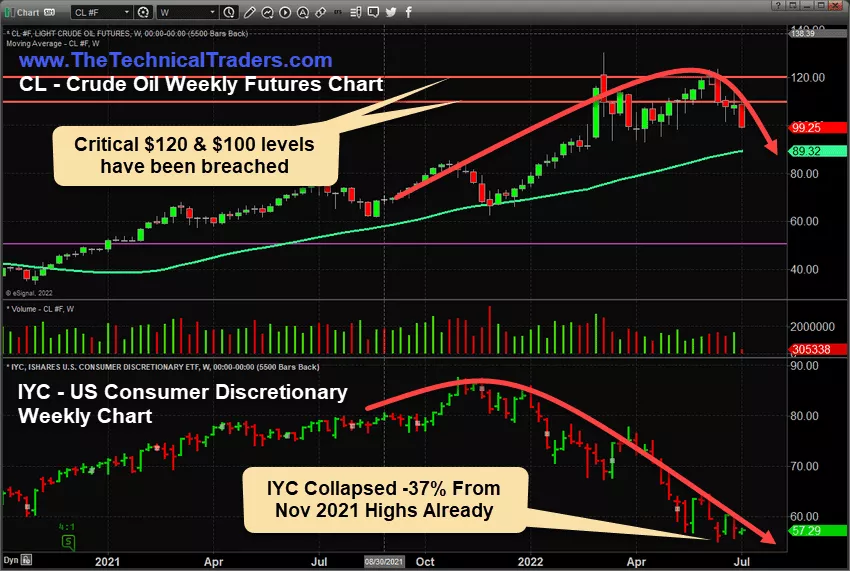
Since November 2021, IYC Has Fallen More Than -37%

This current Weekly Crude Oil & IYC Chart shows IYC has collapsed by more than -37% from the November 2021 highs – well beyond the -27% collapse in 2008 that preceded the 2008-09 Global Financial Crisis event. Is the current collapse in IYC a sign that a broad global crisis event has already begun to unfold beneath all the news and hype? Will Crude Oil collapse below $75ppb as the global economy shifts away from inflationary price trends and bubbles burst?

Crude Oil Daily Chart

The Deflationary Price Cycle Is Not Over Yet

If IYC falls below $55 in an aggressive downward price move, I would state the risks of a global deflationary price cycle (or extended recession) are still quite elevated. Currently, the $55 price level in IYC aligns with early 2019 price highs and reflects an extended price advance from the $12~$15 IYC price levels in 2008-09.

If the $55 IYC price level is breached to the downside, I expect the $37.50~$40.00 price level to become future support – as that price level reflects the COVID-19 event lows.

Still, these lower price targets represent an additional -32% decline in IYC and reflect a total of a -57% collapse in the Consumer Discretionary sector from the November 2021 peak levels. The potential target range of $37.50~$40.00 correlates with the 2008-09 GFC collapse range when IYC fell from $18 to lows near $8 (nearly -57%).

We are still very early in the shifting deflationary cycle phase after the US Fed started raising interest rates. Learn to protect and profit from this global event with my specialized investment solutions.

Learn more by visiting The Technical Traders!

Chris Vermeulen
Technical Traders Ltd.

Disclosure: This article is the opinion of the contributor themselves. The above is a matter of opinion provided for general information purposes only and is not intended as investment advice. This contributor is not receiving compensation for their opinion.

Oil For The Fire

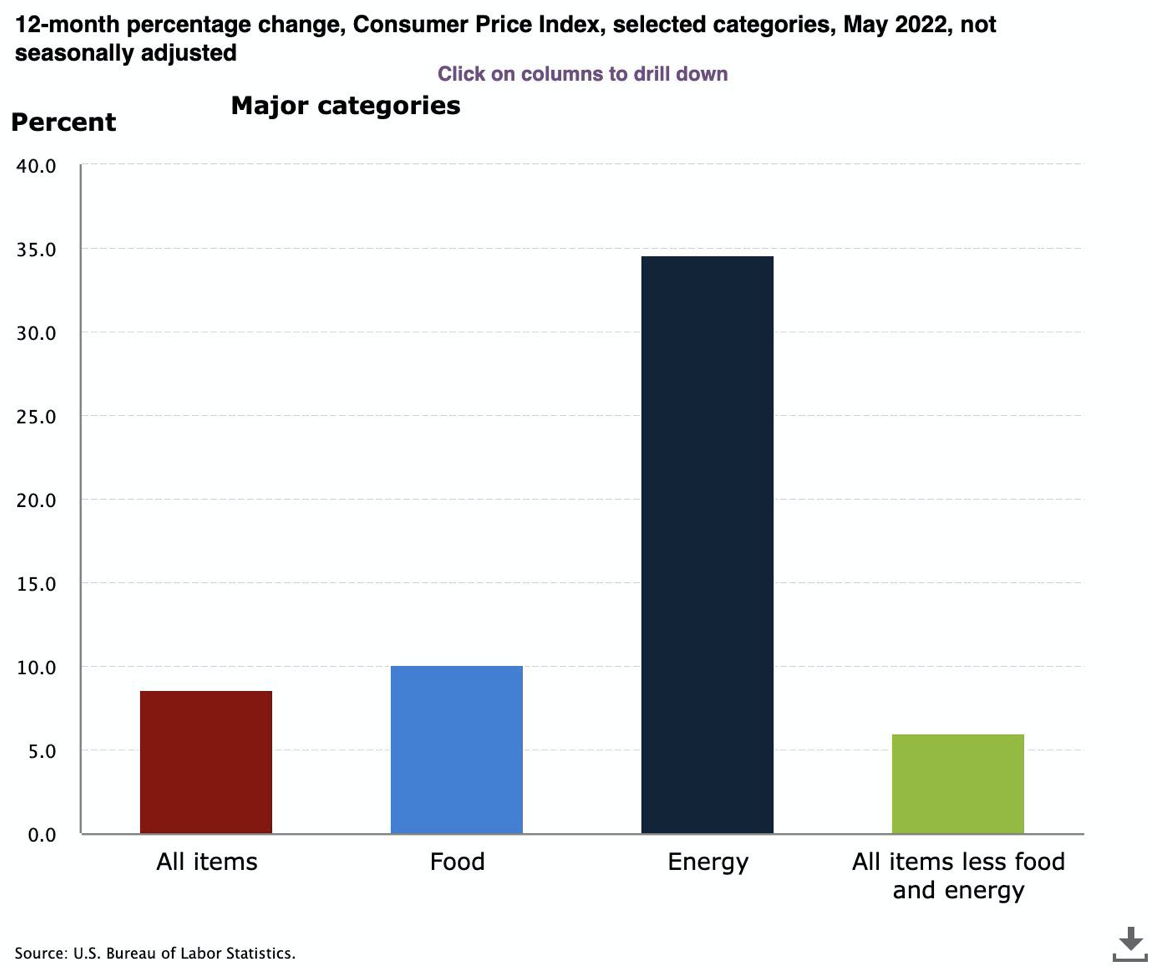
One of the largest factors affecting economic models everywhere has been the volatility of oil prices - just this week, the US Bureau of Labor and Statistics published the monthly inflation number and it wasn’t pretty... The CPI was up 1% in May!

Consumer Price Index - 12 month percentage change

The culprit? A 49% increase in fuel prices; economists were shocked as regular gasoline or airfare costs skyrocketed quicker then they ever have with this being the driving factor.

However, it is in these unaccounted for swings where an investor can truly profit and in analyzing the underlying moves in this economic driver we can see that oil is in one of it’s strongest uptrends of this decade.

Crude Oil Chart

Taking a closer look at oil’s technicals, it is evident that crude’s rally has high volume to support continued buying at higher and higher levels through this decade-leading uptrend.

In fact, the MarketClub tools are still showing a clear buying opportunity on both the weekly and monthly charts even as the commodity trades far above its moving averages.

Only recently have energy prices been caught up in the broader risk-off sentiment of the market this week, creating what I think will be an isolated buying opportunity as RSI on the day chart is clocking in at 50, a level unseen since the beginning of this most recent uptrend just over a month ago.

What’s Catalyzing Higher Prices?

Given the above technicals positioning the commodity-correlated energy sector for an entrance opportunity, diving deeper into the market’s catalysts substantiate that further given a couple of key factors:

The rise of resource nationalism has only become more and more prevalent since the onset of the Ukraine-Russia conflict.

An increasing amount of countries have become more cognizant of the need to protect their natural resources and put themselves first by choking the international market of their supplies... this has created a supply-push inflationary environment that shows no signs of stopping as Libya became the most recent country to stop exporting oil just this week!

Crude Oil Chart

Everyone’s favorite cartel won’t be able to make up for this shortage.

At OPEC's last ministerial meeting just over a week ago, the group decided to increase oil output by an extra 648,000 b/d over both July and August...

This only makes up for half of what the market has lost from Russia alone and the problems with OPEC’s production don’t end there; in fact, it’s around this time of the year that many member countries service their production facilities, putting even more of a strain on output (stay on top of OPEC news and read their meeting notes here)

Investing In This Arena – BP & USOI

Starting with one of the world’s 7 ‘supermajor’ oil producers, British Petroleum Plc (NYSE:BP) is a solid foundational energy pick for your portfolio that stands out from the rest - it hasn't rallied to the degree of its peers and is still discounted by the market! That is despite BP’s promising growth catalysts and its 10 quarter run of positive earnings surprises.

BP has only been sold cheaply as a result of the high CAPEX on their ESG/green initiatives (more than any other firm in the space), this will pay multiples in the future so why not get paid a stunning 3.93% dividend yield to wait for them to become the industry leader of the energy sector’s future?

BP Chart

Alternatively, if you want a less systematically risky pick and you’re more of a sector investor, I believe USOI is the holding for you. This product by Credit Suisse is a unique oil fund in the sense that it is a covered call exchange traded note (ETN) that tracks and provides returns based on the performance of the price return version of the Credit Suisse Nasdaq WTI Crude Oil FLOWS™ 106 Index (QUSOI).

The best part of this ETN is its otherworldly monthly coupon yield - the yield currently sits at 21.27% on an annualized basis and the fund has already paid 86 cents-per-share to the investor YTD.

Don’t sleep on either of these picks as the energy sector has dethroned tech as Wall Street’s favorite in this new economic shift!

Visit back to read my next article!

Peter Tsimicalis
INO.com Contributor

Disclosure: This article is the opinion of the contributor themselves. The above is a matter of opinion provided for general information purposes only and is not intended as investment advice. This contributor is not receiving compensation (other than from INO.com) for their opinion.
Retail Fuel Prices Skyrocket

“The following is an excerpt from Tim Snyder’s “Weekly Quick Facts” newsletter. Tim is an accomplished economist with a deep understanding of applied economics in energy. We encourage you to visit Matador Economics and learn more about Tim. While there, you can sign up for his completely free Daily Energy Briefs and Weekly Quick Facts newsletters.”

Today’s fuel prices are showing us that with increasing demand, the price for refined products will continue to rise, even with a somewhat stalling crude oil price. Today’s EIA posting for On-Highway Retail Gasoline price was $4.107 per gallon. Remember, in 18 states, beginning this Saturday; the US EPA has mandated the more expensive “Summer Blend” of gasoline. This gasoline blend will stay in place until Mid-September, as demand remains strong and the temperatures are warmer this time of year.

Diesel prices look to be outpacing gasoline and the changes in crude oil prices as well. Monday’s EIA posting for On-Highway Retail Diesel price was $5.16 per gallon. These prices will soon eclipse the records we saw in March of this year. We were trading at $5.25 per gallon on March 14, 2022, and with diesel fuels' current supply issues, we will top this by Mid-May. This will push food prices higher and make planting time in the Agriculture space as expensive as it ever has been!

We’re still on an upward track on fuel prices! Continue reading "Retail Fuel Prices Skyrocket"