Truth: The New Frontier In Energy

“The following is an excerpt from Tim Snyder’s “Weekly Quick Facts” newsletter. Tim is an accomplished economist with a deep understanding of applied economics in energy. We encourage you to visit Matador Economics and learn more about Tim. While there, you can sign up for his completely free Daily Energy Briefs and Weekly Quick Facts newsletters.”

What is it about the truth that scares people?

I remember a time when finding the truth from a political party or the press was essential to the bond that both would build with their constituents. I know that sounds pretty naïve, and there has been politically leaning news media since way before I was born, but the truth is, we all used to read the newspaper for the facts, and if they got the facts wrong, they would print a retraction and fix the mistake. Sadly though, those days are long gone.

Today, however, the truth is more like the seasoning you put on your pasta primavera. It accentuates what it needs to but never overpowers the narrative. Unfortunately, that’s what is happening in the battle between fossil fuels and renewable energy today. The facts are sprinkled about to not offend the narrative that the economy desperately needs fossil fuels, and renewables are nowhere near ready for “center stage”.

Let’s have a little truth for a change! Continue reading "Truth: The New Frontier In Energy"

U.S. Crude Oil Production Leveling In June 2021

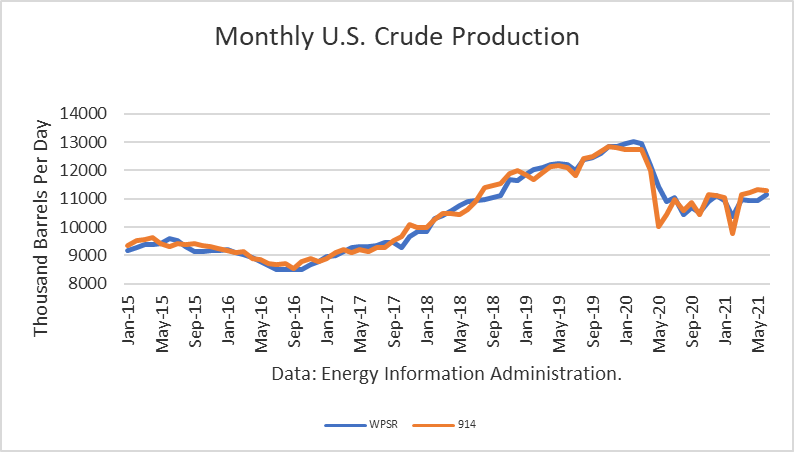
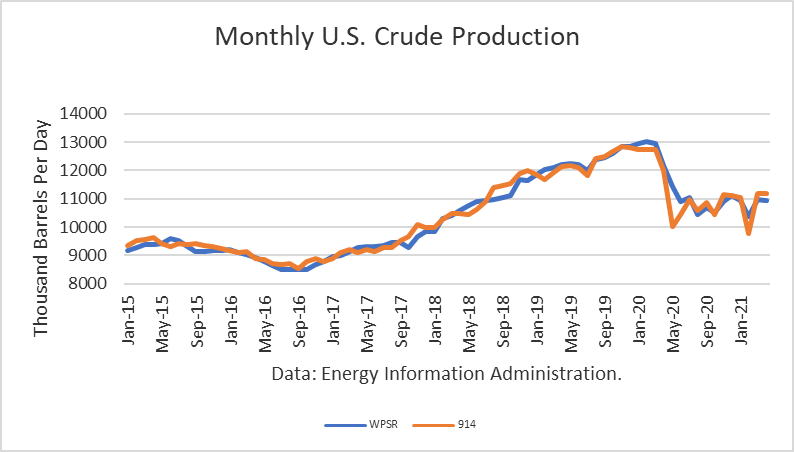
The Energy Information Administration reported that June crude oil production dipped by 5,000 barrels per day, averaging 11.307 mmbd. This follows a modest decline in April. In addition, the June 914 figure compares to the EIA’s weekly estimates (interpolated) of 11.141 mmbd, a figure that was 164,000 lower than the actual 914 monthly estimate.

Monthly US Crude Oil Production

A largest gain was in New Mexico (43,000 b/d), followed by The Gulf of Mexico (18,000 b/d). On the other hand, production in Texas actually decline by 22,000 b/d.

Given the huge reduction in May 2020, production recovered by 865,000 b/d over the past 12 months. This number only includes crude oil. Continue reading "U.S. Crude Oil Production Leveling In June 2021"

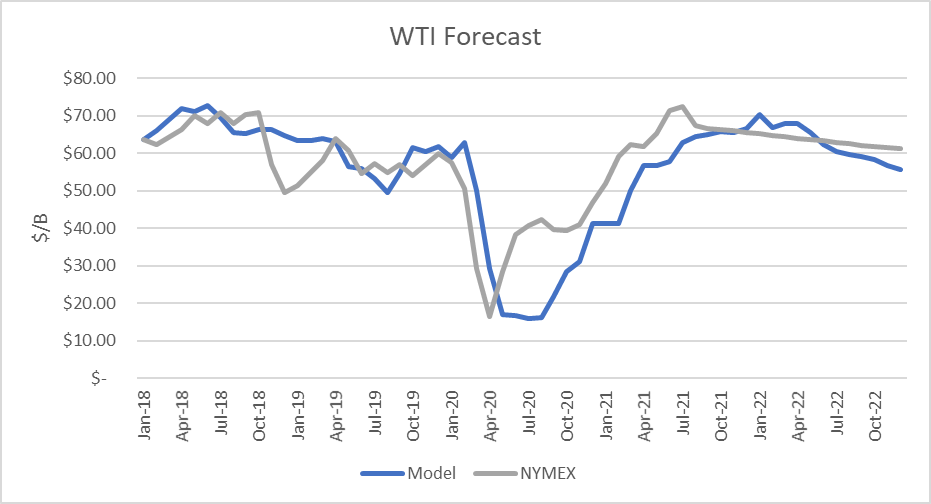
World Oil Supply And Price Outlook, August 2021

The Energy Information Administration released its Short-Term Energy Outlook for August, and it shows that OECD oil inventories likely peaked at 3.207 billion in July 2020. In July 2021, it estimated stocks fell by 13 million barrels to end at 2.860 billion, 348 million barrels lower than a year ago.

The EIA estimated global oil production at 97.42 million barrels per day (mmbd) for July, compared to global oil consumption of 98.78 mmbd. That implies an undersupply of 1.15 mmb/d, or 42 million barrels for the month. Given the decrease in OECD stocks, non-OECD stocks are implied to have increased by 29 million barrels.

For 2021, OECD inventories are now projected to draw by net 208 million barrels to 2.819 billion. For 2022 it forecasts that stocks will build by 90 million barrels to end the year at 2.908 billion.

Crude Oil

On July 18th, OPEC agreed to:

“Adjust upward their overall production by 0.4 mb/d on a monthly basis starting August 2021 until phasing out the 5.8 mb/d production adjustment, and in December 2021 assess market developments and Participating Countries’ performance.”

The current “reference production” and adjustments levels are detailed in the table below. Continue reading "World Oil Supply And Price Outlook, August 2021"

U.S. Crude Production Rises In May

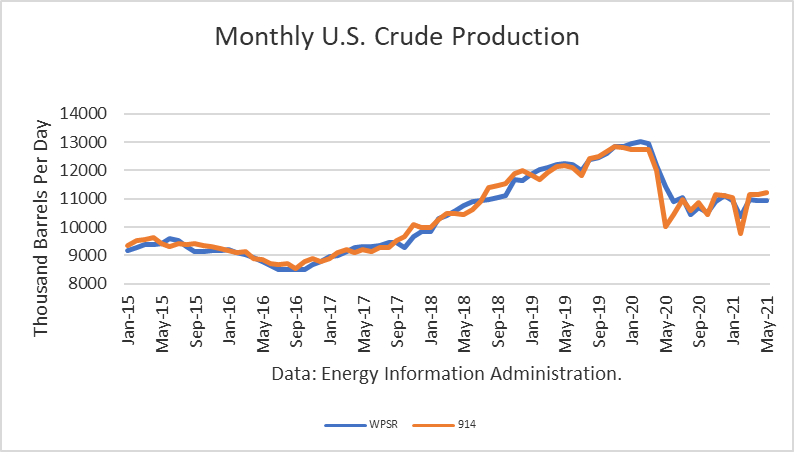
The Energy Information Administration reported that May crude oil production rose by 80,000 barrels per day, averaging 11.231 mmbd. This follows a modest decline in April. The May 914 figure compares to the EIA’s weekly estimates (interpolated) of 10.955 mmbd, a figure that was 276,000 lower than the actual 914 monthly estimate.

Monthly US Crude Production

The largest gain was in New Mexico (49,000 b/d), followed by The Gulf of Mexico (29,000 b/d) and North Dakota (26,000 b/d). On the other hand, production in Texas actually declined by 22,000 b/d.

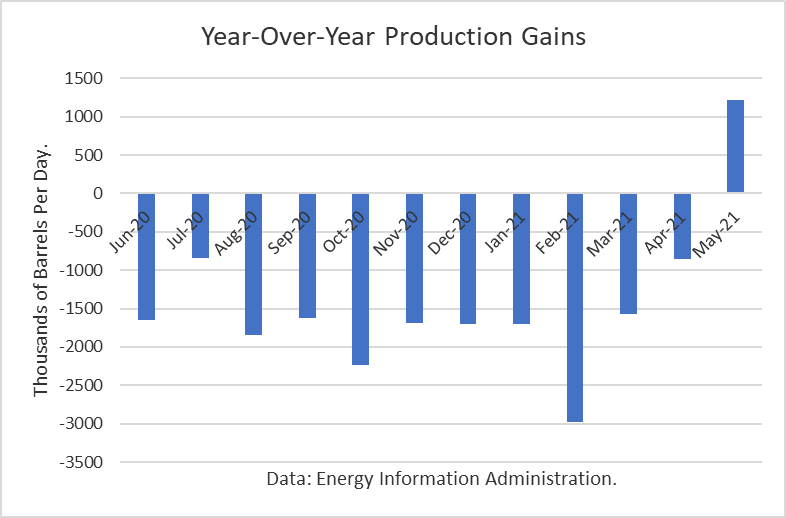
Given the huge reduction in May 2020, production recovered by 1.2 mmb/d over the past 12 months. This number only includes crude oil.

Year Over Year Crude Production Gains

The EIA-914 Petroleum Supply Monthly (PSM) average figure was nearly identical to the weekly data average reported by EIA in the Weekly Petroleum Supply Report (WPSR). Continue reading "U.S. Crude Production Rises In May"

U.S. Crude Production Off In April 2021

The Energy Information Administration reported that April crude oil production dipped 19,000 barrels per day, averaging 11.169 mmbd. This follows a gain of 1.415 mmb/d in March as production returned after the freeze in Texas. In addition, the April 914 figure compares to the EIA’s weekly estimates (interpolated) of 10.947 mmbd, a figure that was 222,000 lower than the actual 914 monthly estimate.

Monthly US Crude Production

A large decline in the Gulf of Mexico (92,000 b/d) caused a dip in U.S. production. However, that drop was largely offset by gains in Colorado (31,000 b/d), Texas (28,000), and New Mexico (17,000).

Given the huge reduction in May 2020, production dropped by 841,000 b/d over the past 12 months. This number only includes crude oil. Continue reading "U.S. Crude Production Off In April 2021"