World Oil Supply And Price Outlook, March 2019

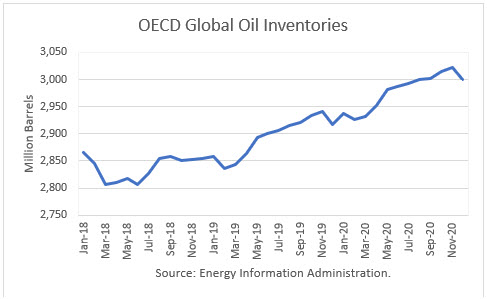
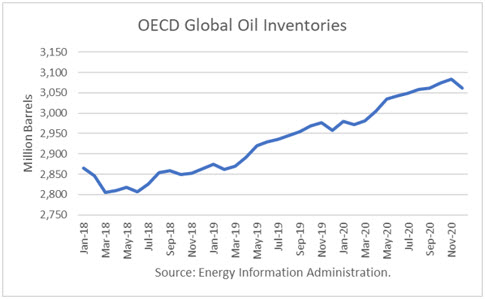
The Energy Information Administration released its Short-Term Energy Outlook for March, and it shows that OECD oil inventories likely bottomed last June at 2.806 billion barrels. It estimated a 21-million barrel decline for February to 2.837 billion, 9 million barrels lower than a year ago.

However, throughout 2019, OECD inventories are expected to rise rather quickly through November. At year-end, EIA projects stocks to be 2.918 billion barrels, 64 billion more than at the end of 2018.

For 2020, EIA projects that stocks will build another 82 billion barrels to end the year at 3.000 billion. That would push stocks into glut territory.
oecd oil inventories

Oil Price Implications

I updated my linear regression between OECD oil inventories and WTI crude oil prices for the period 2010 through 2018. As expected, there are periods where the price deviates greatly from the regression model. But overall, the model provides a reasonably high r-square result of 80 percent. Continue reading "World Oil Supply And Price Outlook, March 2019"

World Oil Supply, Demand And Price Outlook, February 2019

The Energy Information Administration released its Short-Term Energy Outlook for February, and it shows that OECD oil inventories likely bottomed last June at 2.806 billion barrels. It estimated a 12 barrel gain for January to 2.875 billion, 10 million barrels higher than a year ago.

Throughout 2019, OECD inventories are generally expected to rise after June. At year-end, EIA projects ending the year with 2.957 million barrels, 94 million more than at the end of 2018.
For 2020, EIA projects that stocks will build another 105 million barrels to end the year at 3.062 billion. That would push stocks into glut territory.

Energy Outlook

Oil Price Implications

I updated my linear regression between OECD oil inventories and WTI crude oil prices for the period 2010 through 2018. As expected, there are periods where the price deviates greatly from the regression model. But overall, the model provides a reasonably high r-square result of 80 percent. Continue reading "World Oil Supply, Demand And Price Outlook, February 2019"

U.S. Crude Production Outperforms In November

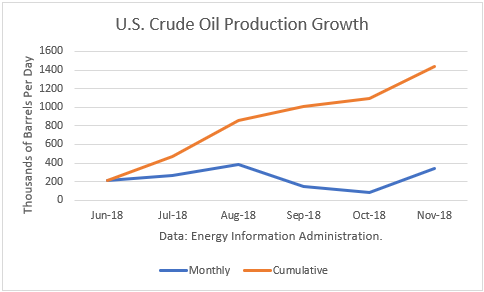
The Energy Information Administration reported that November crude oil production averaged 11.900 million barrels per day (mmbd), up 345,000 b/d from October. This estimate capped a spectacular 6-month gain of 1.436 mmbd from June through November, a period when capacity takeaway constraints had been expected to slow down the growth in Texas.

November crude oil production

The year-over-year gains have been especially impressive with the November figure being 1.801 mmbd. And this number only includes crude oil. Other supplies (liquids) that are part of the petroleum supply add to that. For November, that additional gain is about 500,000 b/d. Continue reading "U.S. Crude Production Outperforms In November"

How Far Could Crude Oil Go?

The price of crude oil closed above the earlier top of $54.6 last Friday to confirm the reversal to the upside. So, is it the right time to find out how far we can go with it?

At the end of last May, I posted an early warning of the imminent crash of crude oil price amid the mass media euphoria from the dream of the $100 price tag per barrel, which was a good contrarian indicator. The price of WTI finally dropped last October after it broke long-term support.

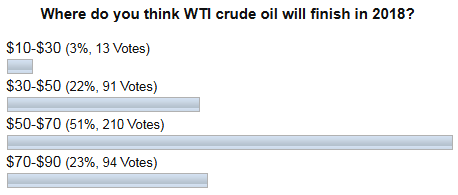
I am very grateful to you as you were very active on the poll where I asked you to share your expectations about the crude oil price by the end of 2018. Below are the results of it.

wti crude oil futures

As we can see most of you were ready for the drop of the oil price in the next lower range between $50 and $70 marks, although there were oil optimists in second place, who bet on the price to be in the $70-$90 range. Only those whose bets ranked the third ($30-$50) turned out to be right as oil finished the previous year at $45.8 after hitting the $42 area the day before Christmas.

In this post, I would like to show you some historical similarities, which could help us to understand how deeply the current pullback could go. Let’s start with the bigger chart. Continue reading "How Far Could Crude Oil Go?"

U.S. Petroleum Supply Expected To Surge To 2025

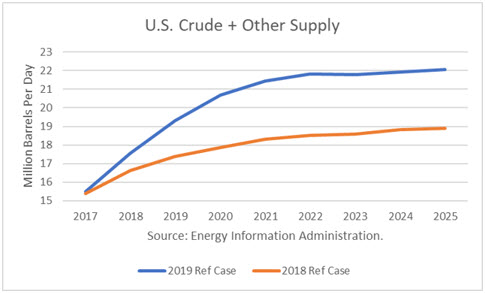
The Energy Information Administration released its Annual Energy Outlook for 2019, and what a difference a year has made. Due to shale oil’s production response in 2018, EIA’s outlook through 2025 shows supplies surging.

Energy Information Administration

The production forecast includes both crude oil and “other supply,” which will be explained in greater detail below. Often, U.S. production is generally limited to crude oil, but other liquids included in petroleum supply, have become a major component and are expected to rise even faster than crude alone.

Total liquids are projected to rise from 17.5 million barrels per day (mmbd) in 2018 to 22 mmbd in 2025 in EIA’s reference (base) case. In its high price scenario, EIA projects 2025 volume could be 26.4 mmbd. By comparison, Russia is producing just over 12 mmbd and Saudi Arabia just over 10 mmbd with its recent cutback. And so US output could be roughly the number two and three highest country volumes combined. Continue reading "U.S. Petroleum Supply Expected To Surge To 2025"