At the end of last month, I called for a substantial upcoming weakness in crude oil as the market could have finished the long-lasting consolidation after the earlier crash from 100+ levels. Indeed, oil lost almost $4 from that time and now is rebounding as markets naturally move in zigzags.
Oil-related currencies also suffer, and in this post, I would like to share with you an exciting chart setup with tremendous profit potential for one of such currency, the Canadian Dollar (CAD) also known as “Loonie” among traders.
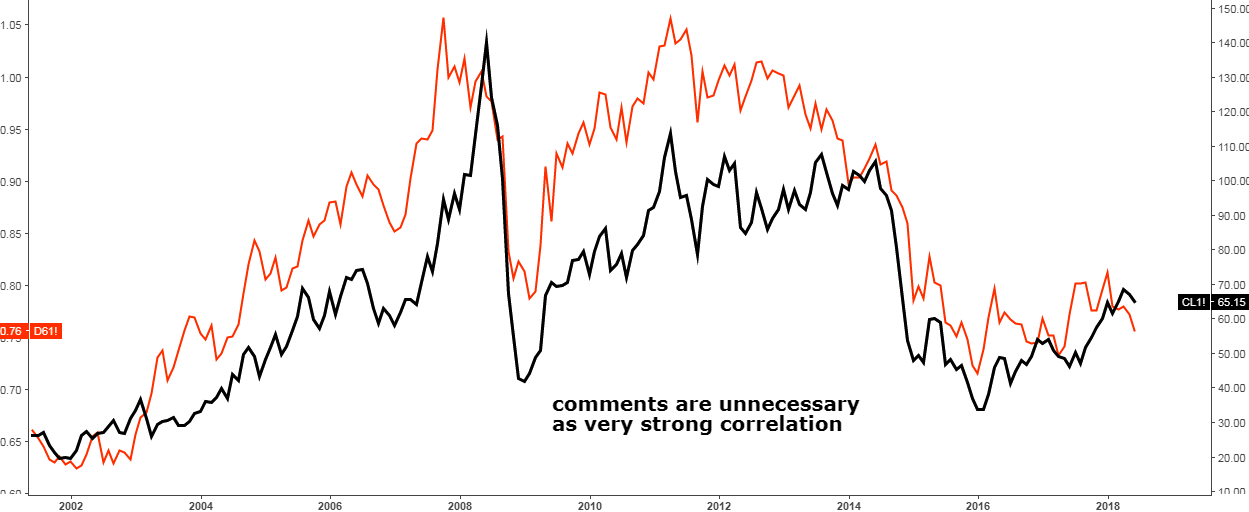
Before that, I built a chart to demonstrate the correlation between WTI crude oil and the Canadian Dollar.
Chart 1. WTI futures Vs. Canadian dollar futures: Perfect Correlation

Chart courtesy of tradingview.com
In the chart above the WTI futures graph is black on the right scale and the Canadian Dollar futures graph (in US$ per 1 CAD) is red on the left scale. I didn’t add any annotations on the chart as you can clearly see that the correlation is just perfect and the most important fact is that the crucial market phases like strong moves and consolidations coincide in time. The Canadian Dollar tends to overshoot WTI amid market strength, but it is quite moderate during market weakness. Continue reading "Does Oil Hold The Key To The Canadian Dollar"


