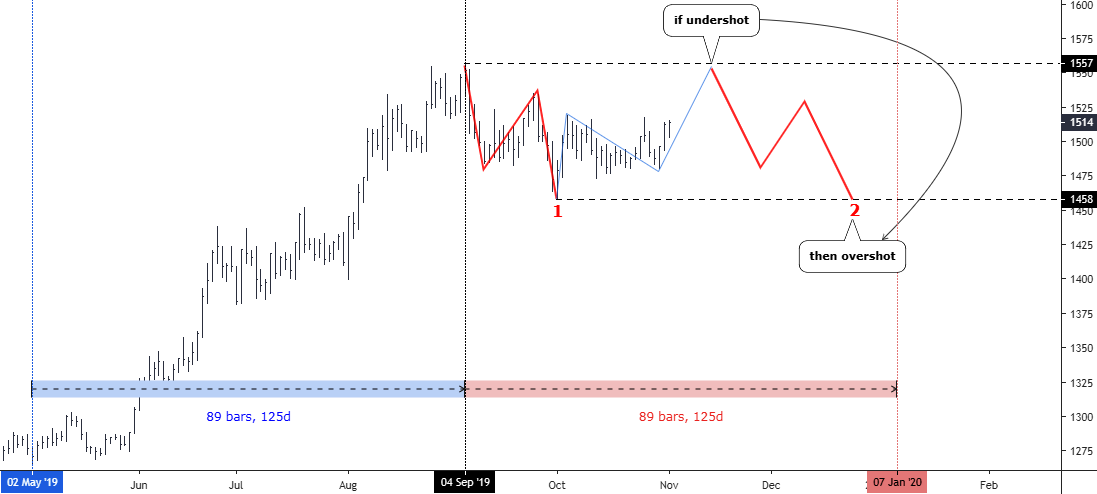
Both metals missed the time targets, which were set on the 13th of December for gold and on the 20th of December for silver in the previous post as I was expecting the Last Drop Ahead Of Santa Claus Rally.
I updated the charts below and went deep into the anatomy of the current consolidation in the "bc” segment to show you in detail what holds the price for so long delaying the last drop. For that reason, I switched to a lower time frame of 4-hour.
Let me start with the silver chart as it has a less complicated structure than gold, and I will use it as a navigator.
Chart 1. Silver 4-hour
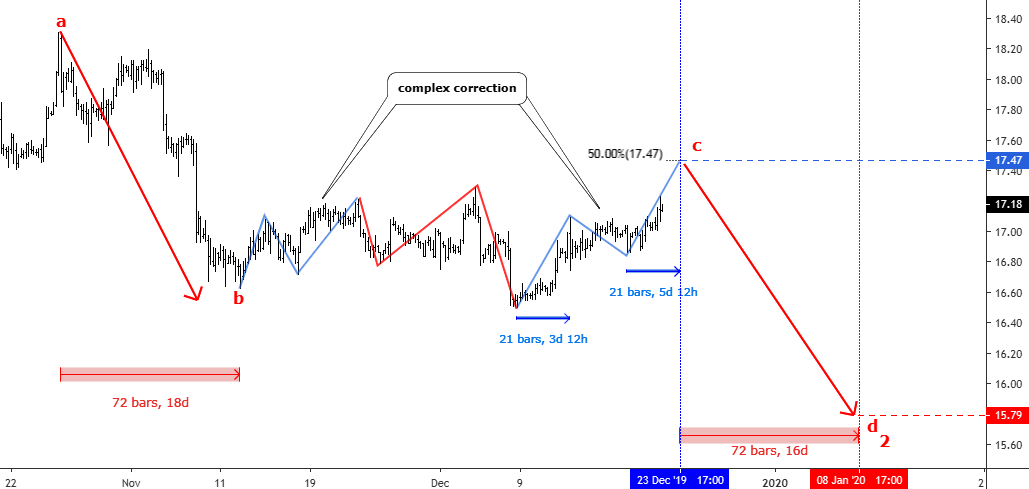
Chart courtesy of tradingview.com
Corrective structures are tricky as I always repeat it as a mantra, but it really has such a nature as it reflects the uncertainty in the market mixed with attempts of different market forces to break out of the current status quo. This creates sharp zigzags and false breakouts as we see it on the silver chart above. Continue reading "Gold & Silver: Santa Claus Rally Postponed"