A New Bull Market In Gold?

We continue to think precious metals are one of the best risk vs. reward opportunities right now.

Last week, we shared the Gold to $5K Report with you from our friends over at All Star Charts.

You can check it out here, in case you missed it. The report outlines all of the reasons why Gold could hit $5,000/oz. sooner than the crowd expects.

Today we want to reiterate that it's not just Gold that looks attractive here. Silver is also poised to move higher.

Gold and Silver Futures Chart

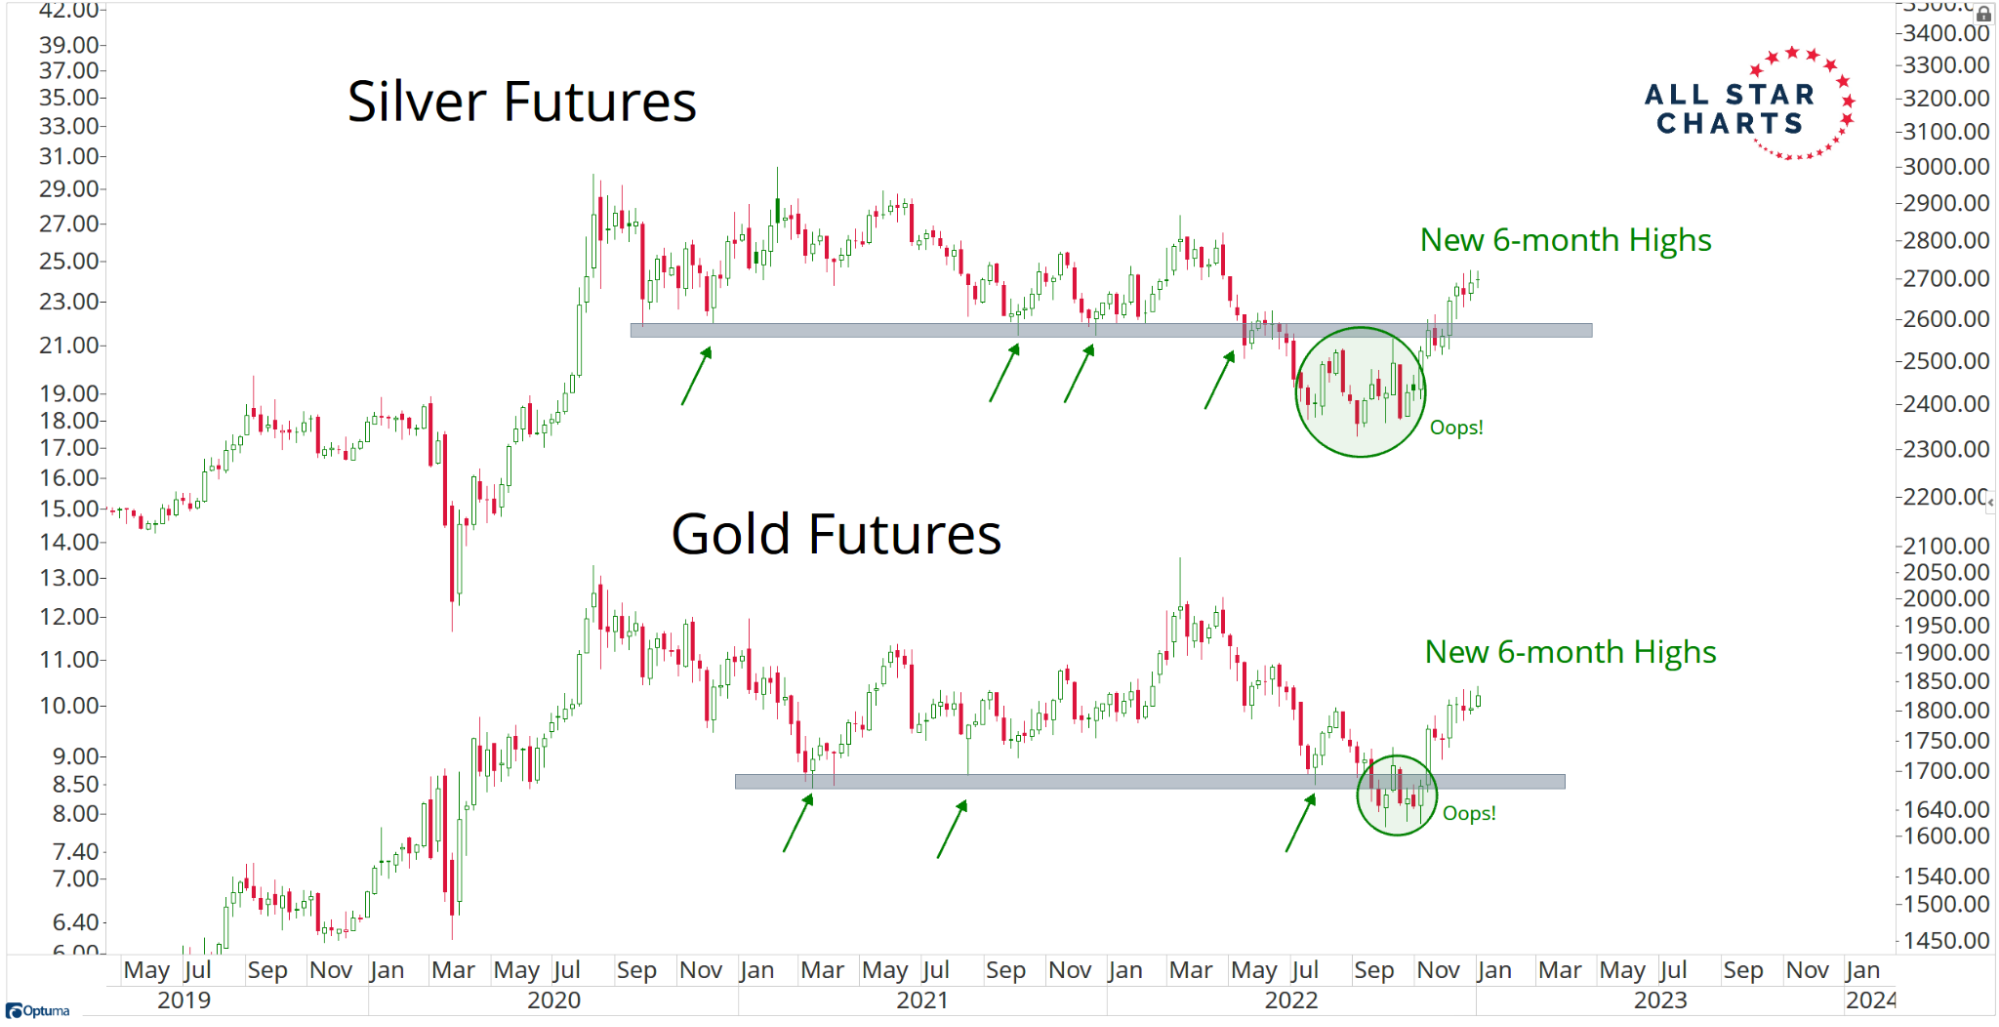
As you can see above, Gold & Silver are confirming one another by hitting 6-month highs together.

The current leg higher began a couple of months ago after both metals formed a failed breakdown at support. As you might know, failed breakdowns often lead to fast moves higher, and we're starting to see that play out.

Silver Futures Chart

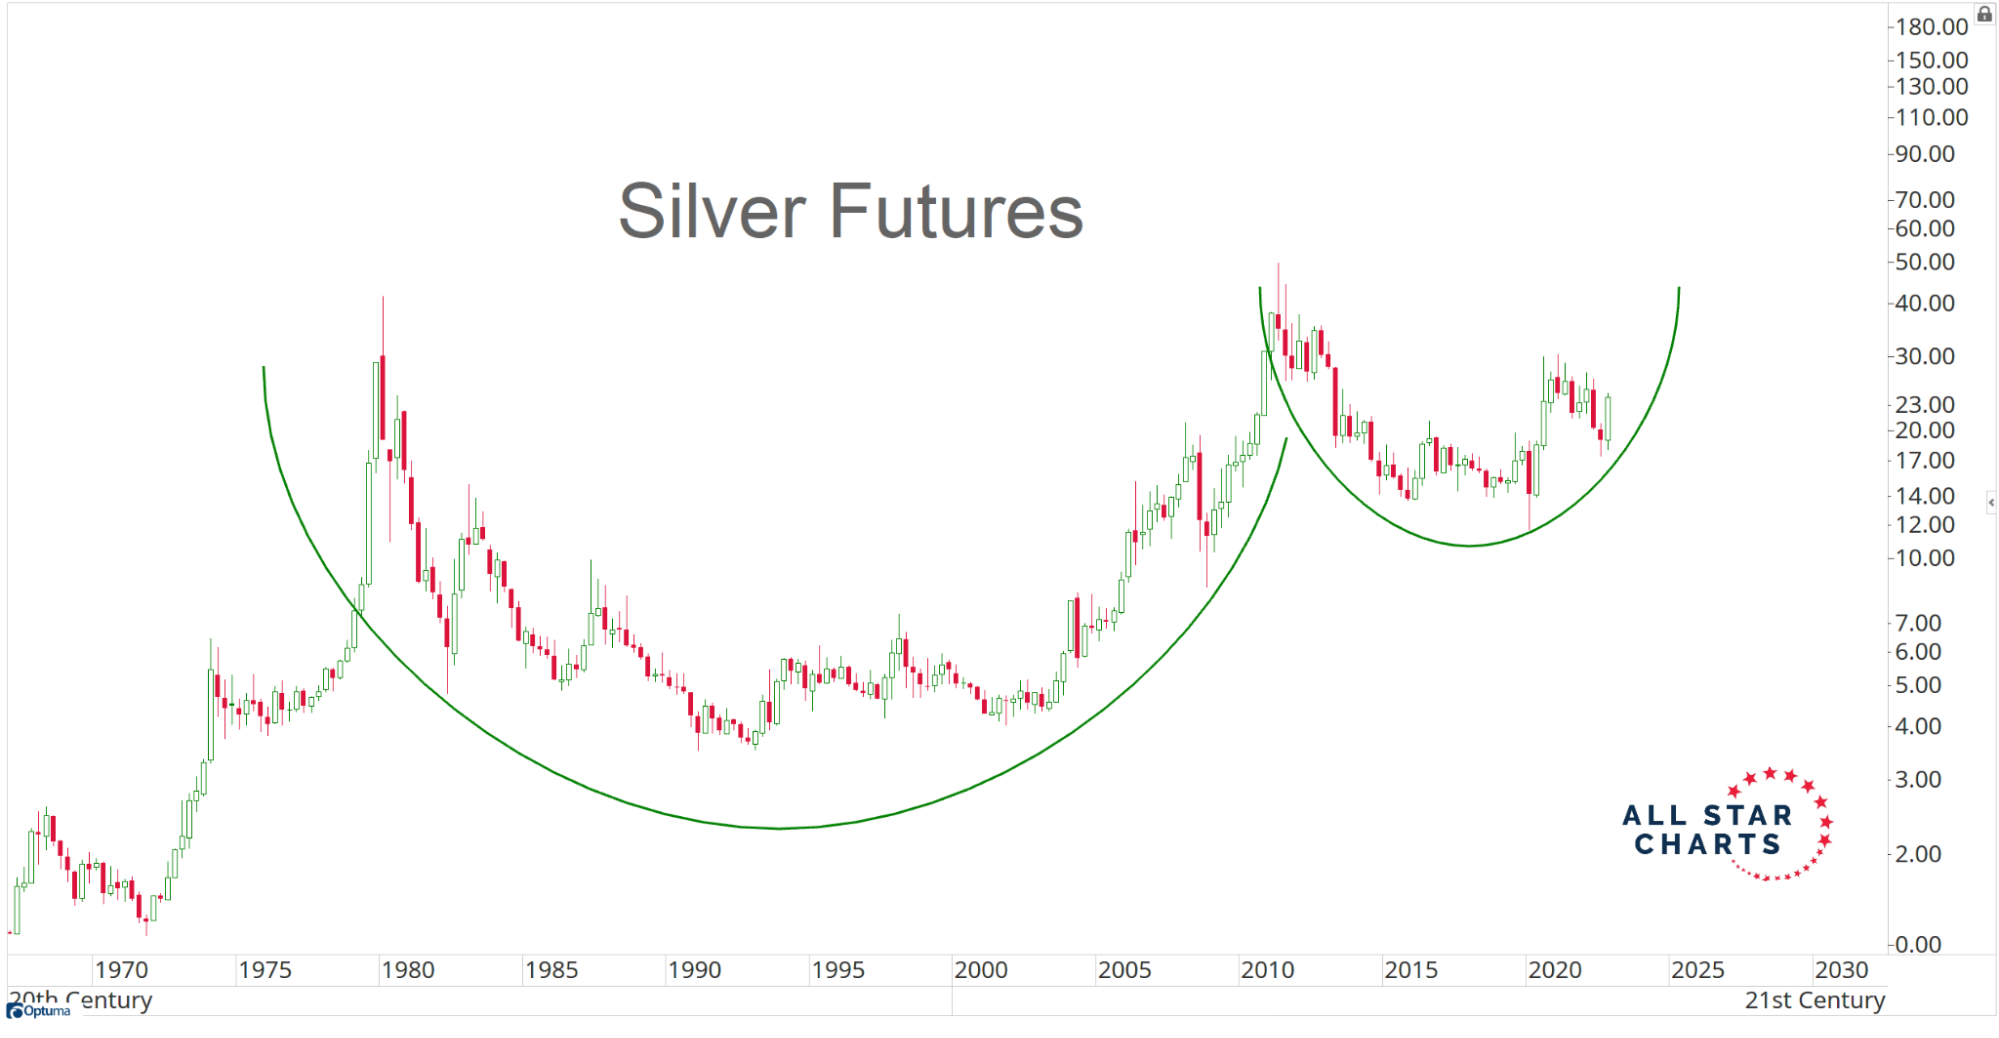
When you zoom out and look at a long-term chart of Silver, you'll notice it's in the process of forming a massive Cup & Handle pattern that dates back to 1980.

The next long-term objective for Silver is around $50, which is the all-time highs from 1980/2011. That's more than 100% higher here!

Be sure to download this free report to learn how to profit from this potentially historic move.

Enjoy,
The INO.com Team

Gold Chart of The Week

Each Week Longleaftrading.com will be providing us a chart of the week as analyzed by a member of their team. We hope that you enjoy and learn from this new feature.

Weekly Gold Report (July 22nd through July 31st)

Ben Bernanke remained in the spotlight last week when his testimony reminded global markets that FED tapering would not begin until unemployment is below 6.5% and inflation is moving above 2%. That was the third or fourth reminder of the outcome of the FOMC meeting that took place a few weeks ago. So just in case anyone forgot the message the first two times, he was sure to get the news to them from another platform.

The reminder kept most commodities nicely underpinned and  provided decent intraday volatility to trade throughout the week. Continue reading "Gold Chart of The Week"

Chart of the Week - Gold

Each week Longleaftrading.com will be providing us a chart of the week as analyzed by a member of their team. We hope that you enjoy and learn from this new feature.

GOLD REPORT FOR WEEK BEGINNING JULY 23rd

 As we wind down the month of July, it should be noted that the trading ranges over the last two months have grown more and more narrow. In June, Gold prices traded within May’s range and thus far in July, Gold prices have traded within June’s range. This type of price action is fairly normal this time of year in the precious Metals, but traders are trying to figure out what will drive prices out of the narrowing range. Continue reading "Chart of the Week - Gold"