Gold Has Stalled At Equilibrium

Back in April 2020, in my post, I had surmised "Gold Could Fly Over A Helicopter Throwing Money" as the fourth round of Quantitative Easing (QE4) had started a month earlier in March 2020 with an initial pledge to inject $700 billion via asset purchases to support U.S. liquidity. The price of gold was $1,681 at that time.

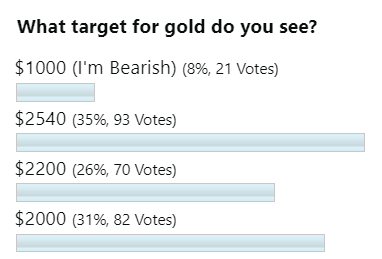
We all knew that the printing press should push gold prices higher. I tried to calculate the possible target area for the gold price using comparative analysis of the past period, and then I set the range of three goals: $2,000-$2,200-$2,540. Your reaction had come as follows.

Gold Poll

The ultra-bullish $2,540 target dominated the ballot. However, the second bet with a more realistic $2,000 target was the closest yet as we saw the all-time high at $2,075 in August 2020. I guess I found the reason for this outcome in the monthly chart below. Continue reading "Gold Has Stalled At Equilibrium"

Gold, Silver, Gold/Silver Ratio & HUI

Precious metals are still locked down. With an understanding that there is always much more in play than nominal charts (the macro & sector fundamentals for example, which bounced of late but never did definitively flip positive), let’s review said nominal charts of gold, silver, and HUI along with an update of the Gold/Silver ratio for good measure.

Meanwhile, we will continue to update the full spectrum of considerations for a positive view of the precious metals complex, including gold’s standing vs. cyclical, risk-on markets/assets, the state of speculative vs. quality credit spreads, the inflationary backdrop (despite promotions to the contrary, cyclical inflation is not beneficial to the gold mining industry), the seasonal averages and the charts of the metals and miners over various time frames in NFTRH.

Gold

The daily chart shows the gold price (futures) below the moving averages but above short-term support after failing – amid much personally observed cheerleading to the contrary – to cross the bull gateway at 1920.

As a side note, the broken blue downtrend channel on this daily chart is actually the Handle to a large and bullish big picture Cup that only has one thing going against it that I can see; too much exposure by too many TAs, which of course means it may not be expressed until many of those TAs recant their stories (we have noted all along that the Handle can drop all the way to the 1500s without damaging the 2022 bullish Cup story. Indeed, if it were to happen (not predicting folks, but being prepared) it would be healthy. There is nothing healthier than a good running of the bugs before a major bull move. Continue reading "Gold, Silver, Gold/Silver Ratio & HUI"

Santa Claus Rally Kicks Off For Gold

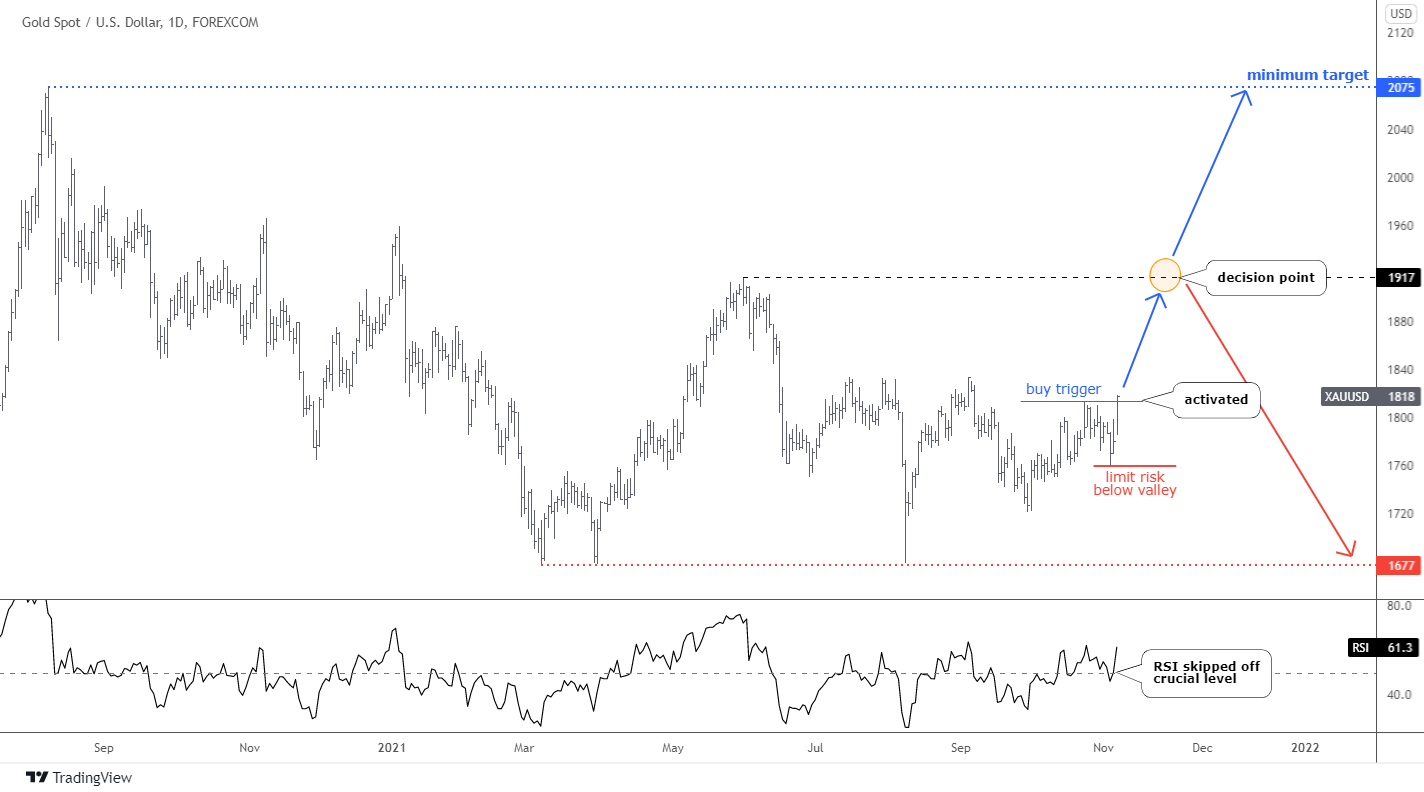
The year is approaching a sunset. It is the right time for precious metals to get ready for a Santa Claus visit to take them for a ride to the sky. One of the metals has already been in the game; I am talking about gold.

Daily Gold Chart

In October, I enriched the bullish view with the newly spotted “Diamond” reversal pattern. Most of you confirmed that you see this pattern. It is still good, as the invalidation level was not touched. Continue reading "Santa Claus Rally Kicks Off For Gold"

Gold; A Thing Of Beauty...

Gold calmly continues cobbling its Handle; Miners lay in wait.

You see, there is all this noise out there. It comes mostly from inflationists touting gold in the same breath as copper, as oil, and as commodities of all flavors (and aside from gold and, to a degree, silver, those flavors are cyclical).

But you also see, gold is counter-cyclical in its best suit. You see on this monthly chart that gold has been forming its Handle to the bullish Cup ever since the inflation trades came to the fore in the summer of 2020. Therefore, you see that those touting gold and inflation together have been wrong for over a year now (and counting).

For those dealing in reality instead of dogma, gold is a candidate to break the Handle at any time. Then it would be off to the target at 3000+ over the course of a year or more. But reality holds another option as well, and that is to finish the Handle making lower.

So why not tune out the perma-pompoms in real-time, realize that the thing is bullish, but the trigger is either coming sooner or later? We are doing that more focused work in NFTRH and associated updates every week and will be on the spot when the proper signals engage.

This chart was created in 2020 as gold spiked to an all-time high and reversed (into the then-projected Handle). Continue reading "Gold; A Thing Of Beauty..."

Bitcoin Triggered Buy Setup, Plus Gold And Silver

Bitcoin is a true modern hero in the financial world as it stands no matter what. Let it be the Chinese government's ban or US regulators and financial elite's rejection.

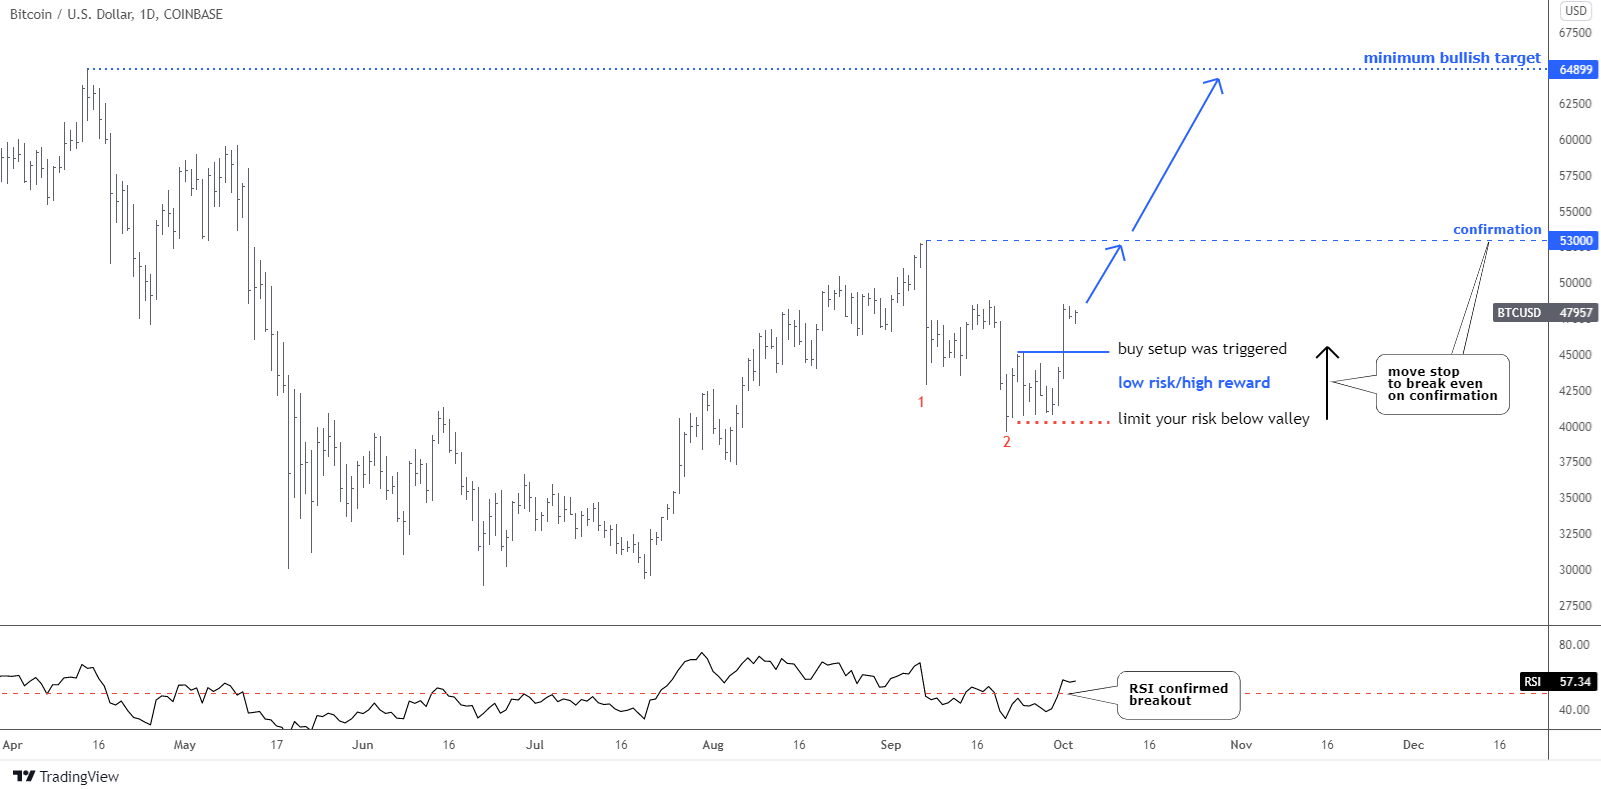
It is amazing how Bitcoin follows a conventional chart structure as it acts like matured instruments over time but at a higher speed. The predicted drop in leg 2 down hasn’t kept us long as it emerged the same day when the previous update was posted.

Most of you thought that this drop could be just a part of a pullback ahead of another Bitcoin rally.

Bitcoin Daily Chart

The collapse in red leg 2 down was close to hitting the preset target of $38k, as it bottomed at the $39,600 mark. The structure looks completed as it has met the minimum requirement to travel an equal distance with leg 1. Continue reading "Bitcoin Triggered Buy Setup, Plus Gold And Silver"