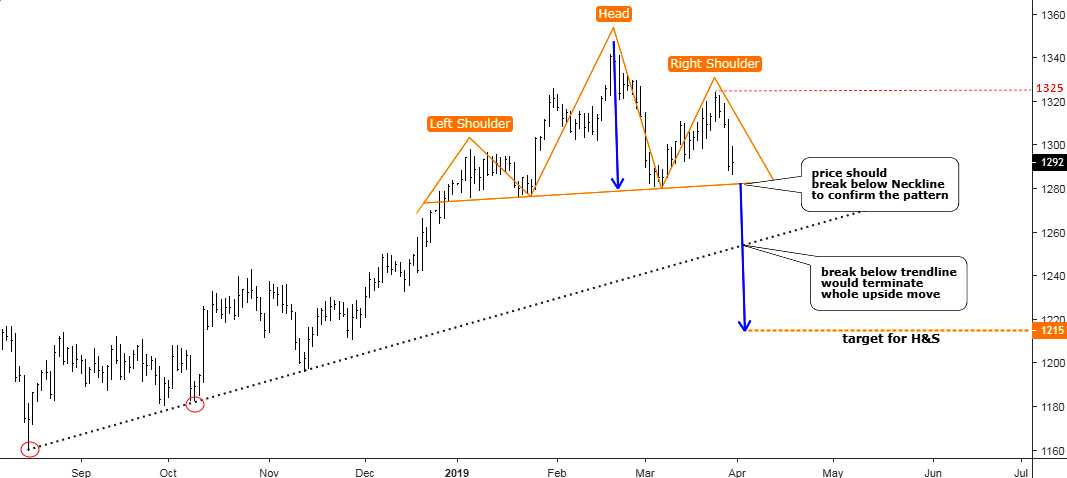
Gold Update: Reversal Pattern Emerges

Last time I updated the gold chart at the beginning of the year I focused on the long-term consolidation, which has started at the end of 2015 and has a tricky structure as all corrective stages do. I shared with you the three most feasible options of structure development.

The first one implies the straight move up beyond the former top of $1375 (blue labels), it took only 22% of your likes. The second option, which you liked the most (48%), offers triangular consolidation (green labels). The third alternative (red labels) gained 30% of your support, and it could bring gold back down to retest $1122 area before it goes up.

I am proud to have such smart readers of my posts as most of the time you accurately predict the market behavior as last time you did it with a Santa Claus rally of precious metals. These days I spotted one notorious pattern, which could terminate the first option, which collected the least support from your voting, that amazes me again and again.

Gold Daily Chart: Possible Head And Shoulders Pattern
LLLL
Chart courtesy of tradingview.com
Continue reading "Gold Update: Reversal Pattern Emerges"

A Precious Metals Update

I reserve most of the work on precious metals for NFTRH weekly reports and in-week updates because it is done on a consistent basis, with the work done previously key to the narrative making sense in real time and going forward. In other words, in order to not be out there stabbing in the dark, you need to have an ongoing, adjustable plan that makes sense at all times with the macro markets around it.

So that said, let’s take a snapshot of where things stand currently with the understanding that this work will need future updates, which will probably not be made publicly. It is up to the reader to do the work required to put context to the picture. Meanwhile, this will free up more space in next week’s NFTRH 538 to focus on some quality miner charts, which sometimes take a back seat to the macro/sector stuff.

Precious Metals Update

First off, Commitments of Traders data are only available through 12.31.18 as a result of the government shutdown. So we are flying somewhat blind from that perspective. At the end of December, the CoT for gold and silver were well on their way to a bearish alignment. Have they maxed their trends and reversed in the meantime? It is quite possible, especially since the metals have taken pullbacks (within their intermediate uptrends) recently.

We have been following an analog to 2001, which saw SPX break down below its 50 & 200 day moving averages as HUI began its bull market. What’s more, SPX then tested its breakdown in Q1 2001… Continue reading "A Precious Metals Update"

Gold Update: This Move Is Too Big To Ignore

Every year ahead of Christmas I traditionally ask your opinion about the possible Santa Claus Rally in the precious metals market. Last time it was on the 10th of December. In that post, I shared my worries about the possible Grinch effect of the emerging strength of the US dollar (DXY index), which could spoil the rally at the end of the year.

Most of you believed that the Santa Claus Rally would happen despite the possible threat from the dollar’s strength. And like many times before you were absolutely right as both metals gained at the end of the year – gold’s price surged $50, and silver’s price jumped more than $1. Tremendous gains, bravo!

At the start of the New Year, I would like to update the medium term gold chart for you. Continue reading "Gold Update: This Move Is Too Big To Ignore"

What's Next For Gold?

Early trading on January 4, 2019, saw Gold reach just above $1300 per ounce – confirming our price target from our research and posts on November 24, 2018. The importance of this move cannot be under-estimated. Traders and investors need to understand the recent rally in the metals markets are attempting to alert us that FEAR is starting to re-enter the market and that 2019 could start the year off with some extended volatility.

Our research has shown that Gold will likely rotate between $1270~1315 over the next 30~60 days before attempting to begin another rally. Our next upside price target is near $1500. We will continue to post articles to help everyone understand when and how this move will happen. We expect Gold to rotate near the $1300 level for at least another 30 days before attempting another price rally.

Pay attention to the Support Zone on this Daily Gold chart and understand that price rotation is very healthy for the metals markets at this point. A reprieve in this recent Gold rally would allow the start of 2019 to prompt a moderate rally in the US stock market as well as allow a continued capital shift to take place. As capital re-enters the global equities markets, investors will be seeking the best investment opportunities and safest environments for their capital. Our belief is that the US stock market will become the top-tier solution for many of these investments. Continue reading "What's Next For Gold?"

The Men Who Stare At Charts

gold/silver ratioI was going to look around to see if I could find a media article out there (complete with a TA trying to sound really important) that would be appropriate to be made fun of in our little Men Who Stare at Charts series. But then I decided to create my own chart, stare at it a little, post it and talk about it (hopefully not too self-importantly).

Introducing an all too busy long-term (monthly) view of the Gold/Silver ratio, along with some key nominal markets.

The Continuum in the lower panel symbolizes the deflationary backbone that has been in place for decades. I maintain that this is a firm marker against which the Fed inflates money supplies, manipulates bonds and by extension manipulates inflation signals. We have been on a theme that like Jerome Powell or hate him, he knows exactly what he is doing because to do otherwise (promote ongoing bubbles on top of bubbles) would, in essence, end the Fed’s racket, as symbolized by a real breakout in long-term yields. Continue reading "The Men Who Stare At Charts"