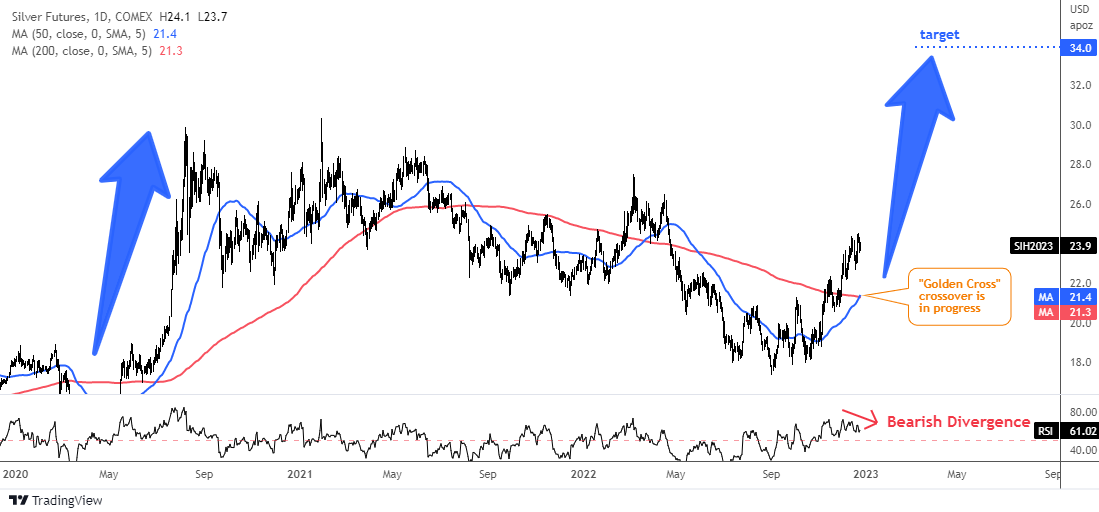
With a market cap of over $20 billion, Dogecoin (DOGE), the world’s leading meme cryptocurrency, appears poised to replicate the bullish “golden cross” technical pattern that presaged its surge in early January 2021.
DOGE has shown impressive performance, with a price increase of more than 62% year-to-date, surpassing the nearly 46% surge in Bitcoin (BTC), the largest cryptocurrency by market cap. Moreover, DOGE has gained approximately 80% over the past three months, while BTC has surged around 24%.
Is the Golden Cross a Bullish Signal for Dogecoin?
A golden cross is a technical chart pattern where a shorter-term moving average, like the 50-day simple moving average (SMA), crosses over a longer-term moving average, such as a 200-week SMA. This crossover indicates that short-term price momentum is faster than long-term momentum, potentially signaling the beginning of a prolonged uptrend.
Traders often rely on moving average crossovers as part of a systematic approach to identifying entry and exit points in the market. The upcoming golden cross on DOGE’s chart, the first in over three years, could potentially trigger a significant price rally, as historical data suggests.
The path to the impending golden cross began when Dogecoin price crossed over its 200-week SMA In March 2023, with a more than 70% rise within a week. Since then, the cryptocurrency has managed to maintain a foothold above this key average, further reinforcing the bullish sentiment surrounding DOGE.
Dogecoin’s Historical Golden Cross
The previous golden cross for DOGE was seen in January 2021, resulting in a remarkable surge in its price. Dogecoin surged from $0.0096 to an all-time high of more than $0.73 by May 2021, a staggering increase of nearly 8,000%. If history repeats itself, a similar surge could occur in the future.
However, the last golden cross in 2021 resulted in significant volatility. Following a massive surge, there was a 90% decline in the subsequent months. Afterward, Dogecoin stabilized and traded within the range of $0.05 to $0.10 from May 2022 to February 2024.
This underscores the highly volatile nature of cryptocurrency investments, particularly in meme tokens such as DOGE, which are highly vulnerable to market sentiment and speculative trading.
Current Macro Conditions and Analysts’ Views
During Dogecoin’s early 2021 run, interest rates were either near or below zero, leading to increased risk-taking across all corners of the financial market. However, the current scenario is different, as interest rates in the U.S. are at a multi-year high of 5.25% to 5.5%.
So, in contrast to the favorable macroeconomic conditions in 2021, the current financial environment presents higher interest rates and escalating geopolitical tensions, which could impact speculative investments differently.
Despite these macro challenges, well-known crypto analyst World of Charts indicates that DOGE is approaching a critical descending trendline, a breakout that could lead to a strong bullish rally in the range of $0.27 to $0.30 in the upcoming days.
According to CoinDCX, Dogecoin’s price in 2024 and beyond will vary, with expectations of a bullish momentum that could help it reach highs of $0.5 by the end of the year.
Although the upcoming golden cross presents a positive outlook for Dogecoin, the volatile history after such events advises caution.
Bottom Line
The golden cross, where the short-term SMA crosses above the long-term SMA, is viewed as a potential reversal of the previous bearish trend and the start of a new upward trend in DOGE’s price. It indicates that new buyers are gaining ground more quickly than long-term holders.
Golden crosses typically lead to increased trading activity as investors react to the bullish signal. This heightened activity may result in higher trading volumes and liquidity in Dogecoin markets, offering more opportunities for traders to enter or exit positions.
The path to the impending golden cross, which would be the first in over three years, began when Dogecoin surpassed its 200-week SMA in March 2023 with a dramatic 70% price surge in just one week. The previous golden cross, which occurred in January 2021, presaged a remarkable price rally where DOGE surged by more than 8,000% to an all-time high exceeding $0.76 by May.
However, the last 2021 run, which resulted in a massive price surge in Dogecoin, was followed by a 90% decline in the subsequent months before stabilizing, highlighting the volatile nature of the cryptocurrency.
As meme coins like DOGE primarily rely on speculation, they are susceptible to fiat liquidity, interest-rate expectations, and other macroeconomic conditions. Unlike the favorable macro environment of 2021, the current financial landscape is characterized by elevated interest rates and growing geopolitical tensions, potentially affecting speculative investment differently.
While the golden cross validates a bullish signal in Dogecoin from a technical analysis perspective, investors should exercise caution and consider other factors, including fundamental analysis, market conditions, and risk management strategies, before making any decisions.


