Gold and silver exchange leading roles in the market quite often, especially on the short-term charts. Last time I wrote about it silver saved gold from collapse at the start of this month. The white metal unexpectedly bounced off the earlier low reversing the drop of the yellow metal.
This time gold took the lead as its failure to break below the Bear Flag let silver lick its wounds and return above the $14 handle.
Both metals are still trapped in the middle of the range set by the earlier heavy drop, which first occurred in gold and then it was repeated in the silver market. In this post, I have focused on the local structure as the bigger picture remains unchanged.
Chart 1. Gold Daily: 3rd Leg Up Is Uncommon But Possible
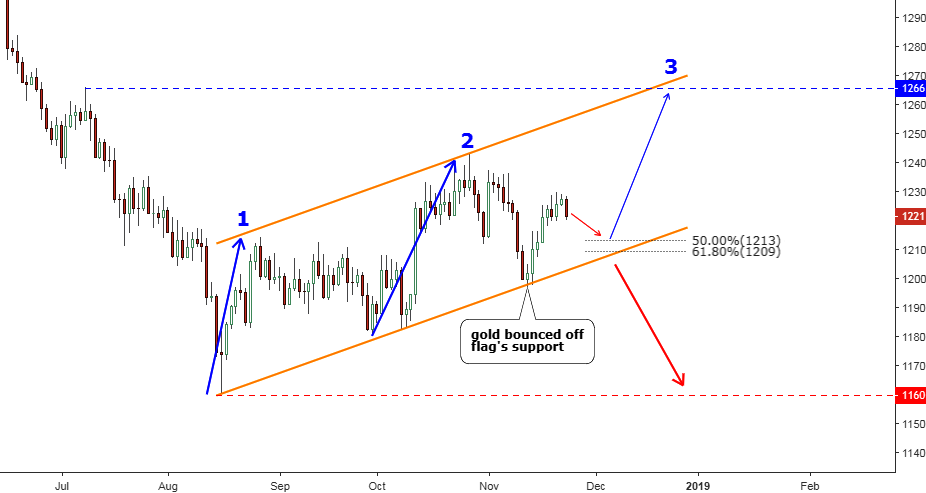
Chart courtesy of tradingview.com
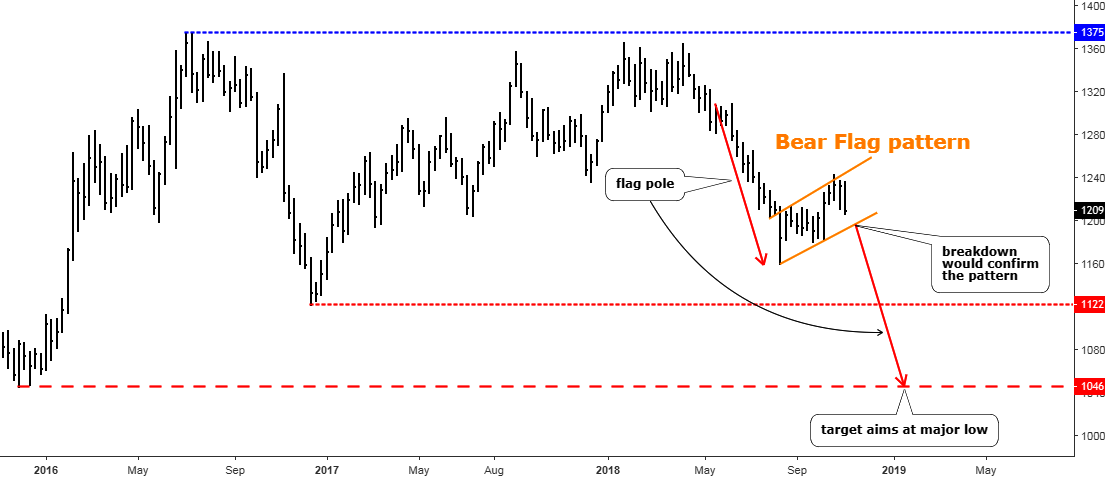
The top metal couldn’t break below the trendline support of a Bear Flag (orange) and then quickly restored most of its losses coming back above $1200. It is interesting that the forecasted drop unfolded quite differently in each metal. Silver tagged the earlier trough, but gold failed even to breach the vertically sloped trendline. It looks like strong demand appeared right at the round number of the gold price in the $1200 area. Continue reading "Gold Extends Consolidation Giving Silver Another Chance"