Assessing The Short-Term Outlook For The Precious Metals And The Miners

Precious metals expert Michael Ballanger assesses the gold-silver ratio and its ramifications for the market.
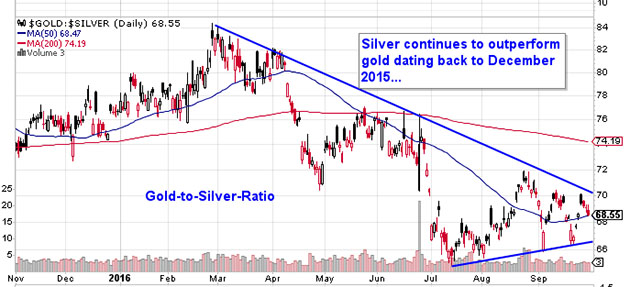
Gold-Silver Ratio Chart

I want to go on the record and state categorically that, in my opinion, technical analysis is of limited value when trying to predict the short-term movements of precious metals. However, there are millions of traders and investors out there who believe that it does work despite interventions, manipulations, and the ability of the bullion banks to fabricate a surrogate for actual physical gold by way of paper futures. In light of that, the short-term technical set-ups for gold and silver and the miners are all different in that after Friday's month-end bombardment, which originated in the London options market, that formidable uptrend line that began in December 2015 has finally been vanquished. The ramifications could be nasty next week because for the second year in a row, the seasonally strong month of September failed to shine (at least for gold). The big question is now whether or not we get a follow-through to the 200-dma at $1,252 before resuming the uptrend or will that large Commercial short position serve as a demand catalyst and limit any meaningful downside? Continue reading "Assessing The Short-Term Outlook For The Precious Metals And The Miners"

Mining Leaders Have More Room To The Downside

Aibek Burabayev - INO.com Contributor - Metals


Back in August of this year, I shared with you the comparison charts of gold and silver stocks. The precious metals hit the new highs before that, and so did the mining stocks. After that, the prolonged correction of underlying assets (gold and silver) put pressure on the mining stocks. Below is the chart showing you the 6 stocks’ behavior.

Chart 1: Top Mining Stocks: The Leaders Lost The Most

Chart 1: Top Mining Stocks
Chart courtesy of tradingview.com

The 3 top gold stocks by past performance: Continue reading "Mining Leaders Have More Room To The Downside"

Gold & Silver: Consolidation

Aibek Burabayev - INO.com Contributor - Metals


Old wisdom says that patience is the key to success. We can see in the charts below that both metals are in a time-consuming consolidation mode. Only patient traders could survive in this situation as see-saw moves play on our nerves.

Chart 1. Gold Daily

Daily Gold Chart
Chart courtesy of tradingview.com

The gold hit a maximum at the $1375 mark this July and couldn’t advance higher. It dropped to the $1310 level at the end of the same month. Another zigzag to the upside was deemed to be a continuation of the bullish move, but it stopped below the July top at the $1367 mark. The next drop hit the $1302 level below the July’s low. The metal has reversed to the upside again and shaped another lower top at the $1352 level last week. I put an orange declining channel to isolate the consolidation for the comfort of your eyes. Continue reading "Gold & Silver: Consolidation"

Silver Miners Could Have Made You A Fortune

Aibek Burabayev - INO.com Contributor - Metals


At the start of this month, I shared with you the comparative dynamics of gold and gold stocks. I joked that the commodities traders could only envy the stock investors as the results of gold purchase were laughable compared to investing in stocks. And today I would love to show you an even more surprising results of silver stocks.

Part I. Comparison

Chart 1. Top Silver Stocks Vs. Silver: This Brilliant League Is Not For Metal
Top Silver Stocks Vs. Silver
Chart courtesy of tradingview.com
The above chart has a high resolution and to see it in a full size; please click on the chart. It shows us the comparative dynamics of silver and the top silver stocks by market cap.

The 5 stocks are sorted by market cap: Continue reading "Silver Miners Could Have Made You A Fortune"

Top Metals Smashed The Euro! Will It Hit Back?

Aibek Burabayev - INO.com Contributor - Metals


I started to cover European gold at the beginning of this year when it was at the 1000 EUR level. In spring I added silver to the pack as it had an interesting setup on the chart. Today I would like to share with you an update of the charts and to show you the outcomes.

Let us start with a single currency chart and see if we can find some clues which could help us with the metal crosses charts.

Chart 1. EURUSD Monthly: RSI Calls For Higher High

EURUSD Monthly
Chart courtesy of tradingview.com

Now, after almost two months, the dust of BREXIT hysteria has settled. The euro has managed not just to survive, but to score more than 2 cents after it touched the $1.09 mark on the referendum selloff in June. Friedrich Nietzsche once said - "That which does not kill us makes us stronger." The light version of the chart above had been shown to you in May.

The euro is still sitting on the very important trendline (dark gray) and the similar price action was earlier when the price approached this trendline. I mean the same combination of lower highs amid higher lows. The RSI has the same divergence as in 2001. This time, we have a flatter downtrend (orange) and the RSI is still below its trendline unlike in the previous case.

There are three triggers which could help the euro to have a big against US dollar once they are broken: Continue reading "Top Metals Smashed The Euro! Will It Hit Back?"