Gold Bulls Have Last Fifty Bucks To Survive

Aibek Burabayev - INO.com Contributor - Metals


The current situation in the precious metals markets very well illustrates how patience in trading can save money for the trader. It means that a trader who waits for the confirmation of the price action has an ample advantage compared to those who choose assumption mode entering the market without confirmation. In other words, the ‘trade what you see’ method is way safer than the ‘trade what you assume’ method. For many years in trading, again and again, I see how true the words said above, especially during market consolidations.

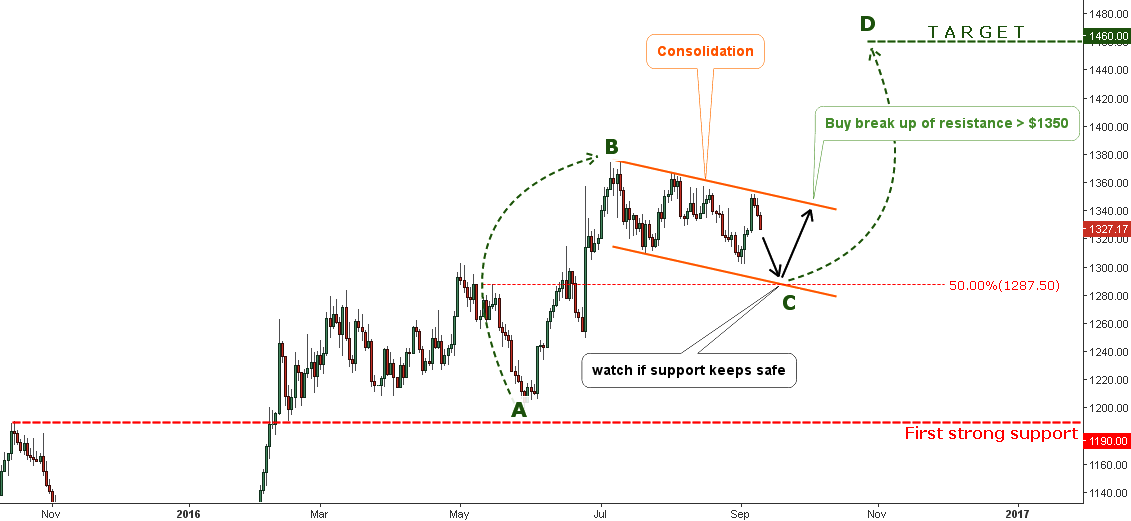
The corrective chart structures are unpredictable though very dangerous, especially for newcomers. As I wrote earlier such structure shows the market’s indecision with a lot of hesitant zigzags which have no clear ending point both in time and in the price level and therefore are risky. Continue reading "Gold Bulls Have Last Fifty Bucks To Survive"

Mining Leaders Have More Room To The Downside

Aibek Burabayev - INO.com Contributor - Metals


Back in August of this year, I shared with you the comparison charts of gold and silver stocks. The precious metals hit the new highs before that, and so did the mining stocks. After that, the prolonged correction of underlying assets (gold and silver) put pressure on the mining stocks. Below is the chart showing you the 6 stocks’ behavior.

Chart 1: Top Mining Stocks: The Leaders Lost The Most

Chart 1: Top Mining Stocks
Chart courtesy of tradingview.com

The 3 top gold stocks by past performance: Continue reading "Mining Leaders Have More Room To The Downside"

Gold & Silver: Consolidation

Aibek Burabayev - INO.com Contributor - Metals


Old wisdom says that patience is the key to success. We can see in the charts below that both metals are in a time-consuming consolidation mode. Only patient traders could survive in this situation as see-saw moves play on our nerves.

Chart 1. Gold Daily

Daily Gold Chart
Chart courtesy of tradingview.com

The gold hit a maximum at the $1375 mark this July and couldn’t advance higher. It dropped to the $1310 level at the end of the same month. Another zigzag to the upside was deemed to be a continuation of the bullish move, but it stopped below the July top at the $1367 mark. The next drop hit the $1302 level below the July’s low. The metal has reversed to the upside again and shaped another lower top at the $1352 level last week. I put an orange declining channel to isolate the consolidation for the comfort of your eyes. Continue reading "Gold & Silver: Consolidation"

Gold Update: Total Recast

Aibek Burabayev - INO.com Contributor - Metals


Dear INO.com readers,

Today Gold hit the $1300 level and I updated my chart for Gold, as it was price trigger for my previous bearish scenario.

In my first article last December I charted the line graph for Gold with a descending triangle pattern detected on this metal. My projection for the mentioned pattern was bearish with quite bold target levels.

What is up today?

The main rule for success is to not to be biased and always challenge yourself with making a brand new analysis from time to time, and surely when market is not going your way.

Today I prepared an absolutely new Gold graph to put fresh eye on it, now with candlesticks.

Gold Chart, small and big wedge chart patterns.

This time I detected a very interesting chart pattern called the “wedge.” This type of patterns is outstanding as it has an ambiguous impact on the market with either a continued or reversed outcome. Luckily, we have two wedges on the same time frame at once. Both are the falling wedge type because of the descending highs and lows. The big one is highlighted in green and the small is in black. Apart from it, we have two more rare technical species on the chart. Continue reading "Gold Update: Total Recast"