I spotted hot trading opportunities for you on daily charts, so let’s skip straight to it. Gold will be the first.
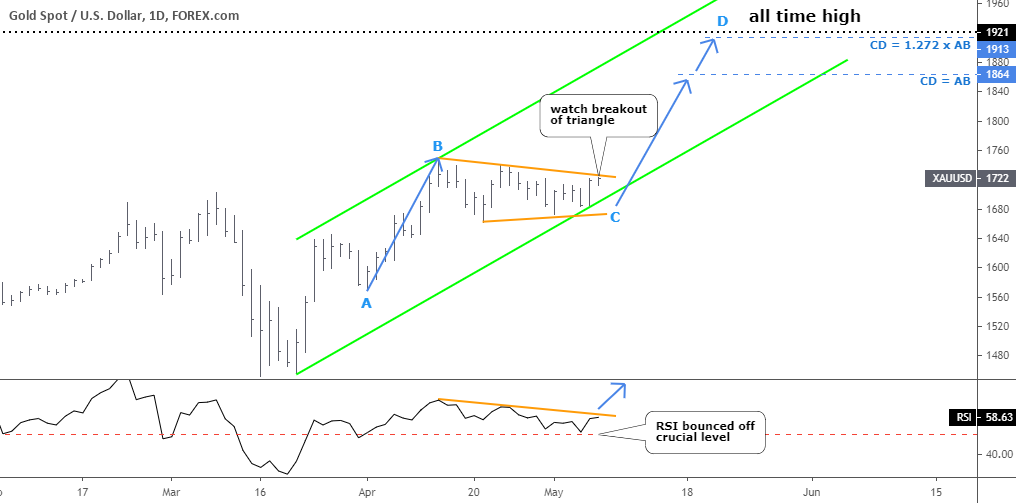
Chart courtesy of tradingview.com
Gold got stuck in a sideways consolidation after it hit a new high of $1748 in the middle of April. The lower peaks and higher troughs shaped a very familiar pattern of a contracting triangle (orange trendlines). The price has reached the upper side of that pattern as I write this post. Watch the price to break up out of the triangle to confirm the move up. Continue reading "Gold Eyes All-Time High As Silver Targets Former Top"