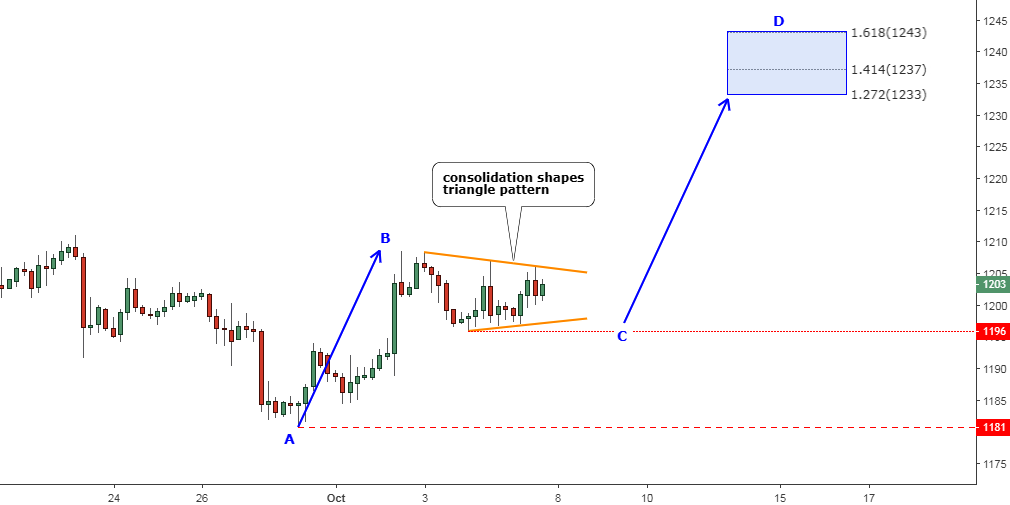
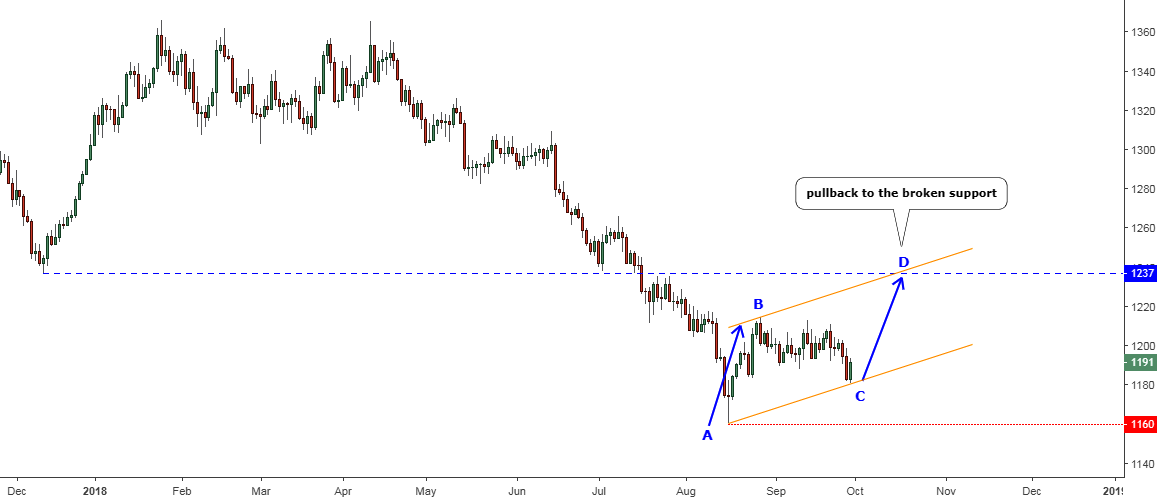
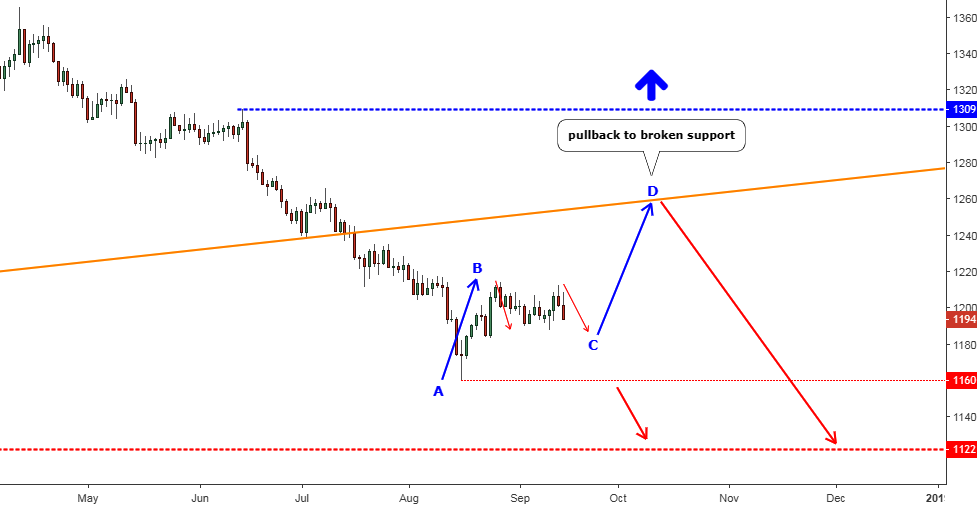
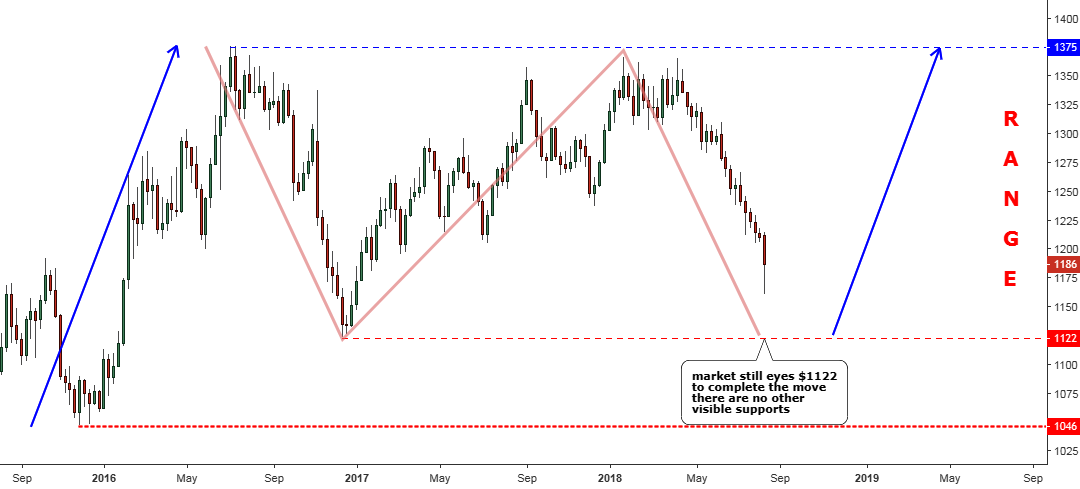
The precious metals are busy finishing the anticipated pullback to the former support, which is almost within our grasp on the short-term charts. So, let it go and in the meantime we can look into the bigger charts with higher time frames to update the outlook beyond the short-term horizon.
Chart 1. Gold Monthly: 1122/1375
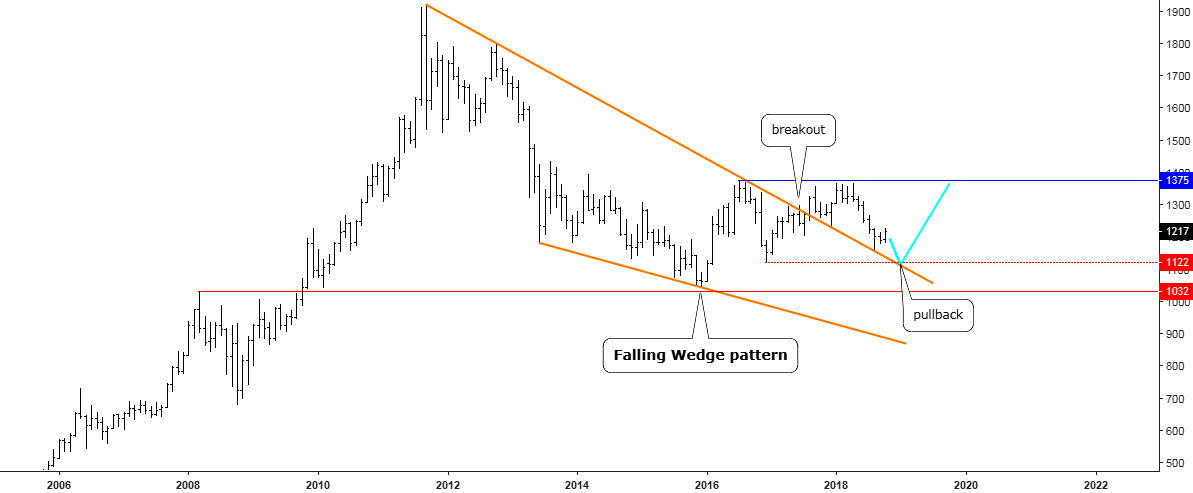
Chart courtesy of tradingview.com
The monthly gold chart above answers some critical questions. The first one, why gold reversed ahead of $1000? The answer is the red horizontal line, which was set at the 2008 top and acted as strong support and breakdown of it would unleash severe volatility into the market as the next level of serious technical support is located in the $700 area (2006 top/2008 bottom). Continue reading "Gold & Silver: Fly or Die"

