S&P 500 Bullish Divergence

Last September, I called the S&P 500 index to lose 30% according to the projection based on a comparative analysis.

The index price was at $4,459 that time. The deepest valley since then was established at $3,637 last month. 18% of the index value evaporated since the idea had been posted and 25% from the top of this January ($4,819).

The majority of you voted for 10%-20% retracement and this was the closest call so far as we cannot be sure whether it is over or not.

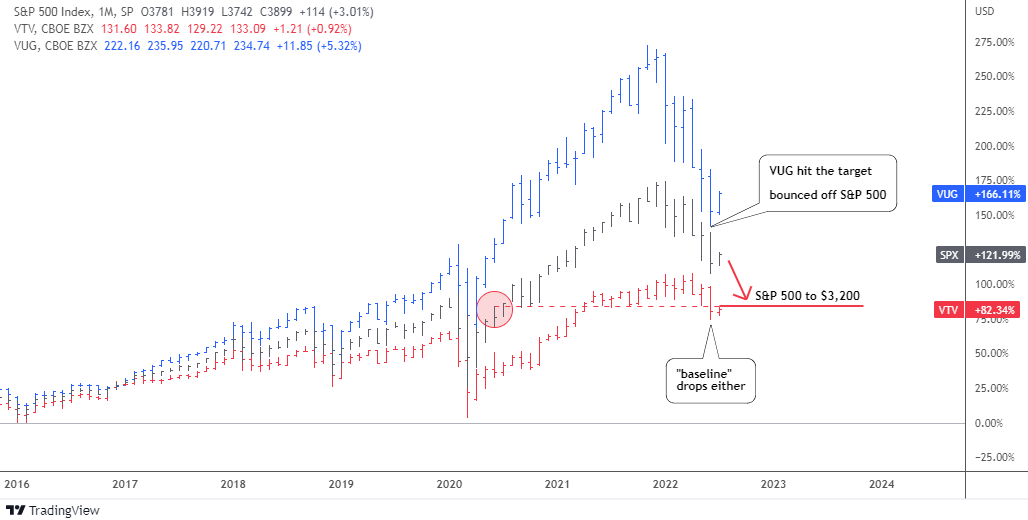
To remind you, I had put together two ETFs and the S&P 500 index (black). I chose Vanguard Value Index Fund ETF (VTV) (red) and Vanguard Growth Index Fund ETF (VUG) (blue). Let us check the updated comparison chart below.

SP500 VTV VUG Comparison Chart

Source: TradingView

The bearish alert appeared to me when the value stocks (VTV, red) stopped contributing to the rise of the broad index. Moreover, the gap between the latter and the growth stocks (VUG, blue) has widened tremendously.

The retracement targets for VUG and the S&P 500 were based on the corresponding level of underlying / less performing instrument: for VUG it was the S&P 500 and for the S&P 500 – VTV.

It is amazing how accurately the VUG target at $217 was hit last month as the ETF dropped even lower in the valley of $213. The concept played out precisely as the VUG bounced off the broad index, blue bars approached but did not overlap black bars.

The S&P 500 index almost closed the gap with the VTV last month, however the VTV itself also dropped and hence wasn’t caught up. The retracement target has been set at $3,200 last September and the lowest level has been seen since then was $3,637 last month.

Let us look at the S&P 500 chart below to see what could happen next.

SP500 Weekly Chart

Source: TradingView

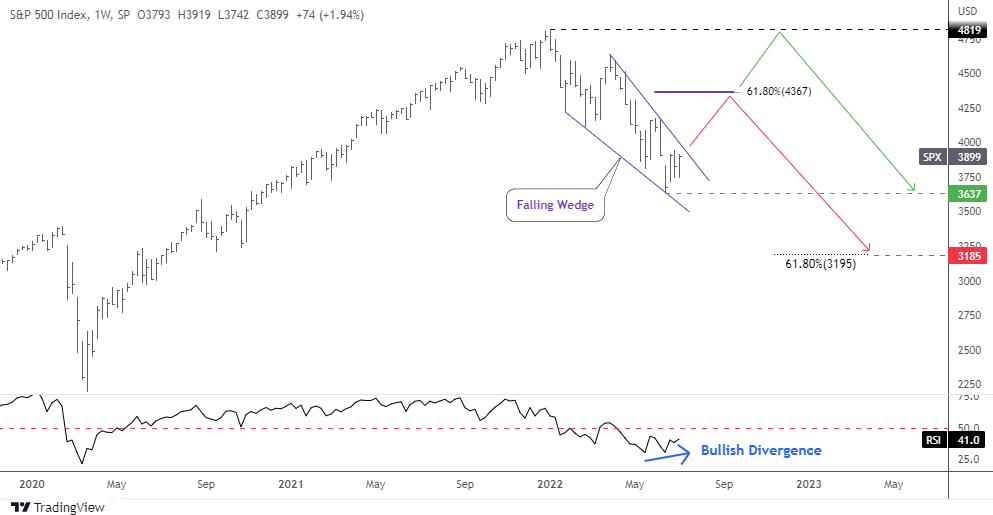
The price has shaped a familiar model of the Falling Wedge (purple) within the current retracement. The amplitude of fluctuations decreases as the price approached the apex of the pattern.

The RSI indicator has already built the invisible Bullish Divergence as it can be seen only through its readings: 30.2 vs. 30.5, which means higher valley versus the lower bottom in the price chart.

This combination of narrowing trendlines and bullish diverging indicator could result in the possible breakup anytime soon. Would it be a reversal or a dead cat bounce?

I added two paths on the chart. The red zigzag shows how the Falling Wedge would play out in the first place. The target (purple flat line) is located at the widest part of the pattern added to the breakup point. It coincides with the 61.8% Fibonacci retracement level at $4,367. It could be a double resistance.

The following drop should complete the complex correction down to $3,185. This target was calculated by subtracting the size of the Falling Wedge from the target of that pattern. And again, this area corresponds amazingly with the 61.8% Fibonacci retracement level and the first chart target based on a comparison with VTV.

The green path implies the sideways consolidation that should keep within the existing range of $3,637-$4,819.

Which way do you think the S&P 500 will go?

View Results

Loading ... Loading ...

Intelligent trades!

Aibek Burabayev
INO.com Contributor

Disclosure: This contributor has no positions in any stocks mentioned in this article. This article is the opinion of the contributor themselves. The above is a matter of opinion provided for general information purposes only and is not intended as investment advice. This contributor is not receiving compensation (other than from INO.com) for their opinion.

'Sentiment Event' Rally Grinds On

Excerpted from this week's edition of Notes From the Rabbit Hole, the Opening Notes segment of NFTRH 602:

As we noted in March while it was happening the sentiment environment became terror-stricken. Not fearful. Not over-bearish. Not even a contrarian extreme. Market sentiment was marked by full-frontal terror as indicator after indicator (ref. Sentimentrader's historic readings week after week) got slammed to epic over-bearish proportions.

Into the breach sprang the Treasury (i.e. taxpayer) backed Federal Reserve to the rescue. As the employment numbers come in at the tragic readings that we all saw coming the bears are out there beating a drum (ah, Twitter) about why it is not right, why the Fed cannot print a bull market, why the stock market is going to make new lows and why you should avoid stocks! They have been saying this since the terror-stricken days of March and they are still saying it now.

And do you know what? The rising risk profile that we have been noting for weeks will likely paint them as being right before too long. Imagine all those 'man who predicted a new stock market crash now predicts... (blah blah blah)' headlines that we will be subjected to as the paint-by-numbers media look to feed easy answers to the public later in the year and into 2021. The bears will probably be right but here’s the thing, they have not been right for nearly 2 months now. Continue reading "'Sentiment Event' Rally Grinds On"

A Market Festivus

They say that Festivus is the “anti-Christmas”, but in this case we are going to call it the anti-Christmas Eve as the markets close out 2018’s Christmas Eve massacre.

“Many Christmases ago I went to buy a doll for my son. I reached for the last one they had, but so did another man. As I rained blows upon him I realized there had to be another way!”

This year markets are going another way.

Market festivus

We have been managing a potential Christmas Eve close-out sale in the stock market since SPX hopped the Bull Turnstile, negating topping potential and confirming bullish ascending triangles (not shown below as they appeared on daily charts) and its own major trends by breaking upward. Here is the most recent chart (from NFTRH 582) used to illustrate the situation.

Please consider this weekly chart for reference only. We had a lot of words in #582 about what I think is in play, but ultimately this public post is simply illustrating what is currently in play. And that is an upside extension (with associated sentiment readings to be updated this weekend in NFTRH 583) that would be roughly equal and opposite to the 2018 downside blow off (note: though the chart allows for higher levels, SPX has already qualified for a price and sentiment close-out, in the general spirit of the season). The blue box is the same height as the yellow shaded area. It’s more art than TA, but there you have it… some frame of reference. Continue reading "A Market Festivus"

Apple + Dow Jones = Better Apple Exposure (Part 2)

Matt Thalman - INO.com Contributor - ETFs


In part one, I explained how the S&P 500 index (^GSPC) and most index tracking ETF's are weighted. The weighting is based on a company's market capitalization, which means that since Apple Inc. (AAPL) is easily the largest company in the world, it carries the largest amount of weight within these investment vehicles. Furthermore in the past I explained how this amount of exposure to Apple may not be a good thing.

But, with Apple recently being added to the Dow Jones Industrial Average (^DJI) investors now have an index to park money and not feel over exposed to Apple due to its size. While the S&P 500 weights companies by its market cap, the Dow weights companies by its share price. Over the years, a number of analysts and market experts have said this is one of the Dow's major flaws and to an extent I would have to agree. But, because Apple is so much larger than all of the other companies within the market, I am very much in favor of this share price weighting format. Continue reading "Apple + Dow Jones = Better Apple Exposure (Part 2)"

Do you know about this cycle in the S & P 500? (new video)

I was just looking at the S&P 500 and I noticed a very pronounced cycle in this market that I want to share with you.

In my new video I explain exactly what I've seen and what I expect will happen to this market if this cycle continues on track.

You can view this new video with my compliments. There are no registration requirements. Please enjoy and give your feedback on our blog. Thank you.

All the best,

Adam Hewison
President, INO.com
Co-creator, MarketClub