Happy Thanksgiving! I hope you spend this time with family and friends enjoying their company and eating delicious food! Today I've asked Behrouz Fallahi from http://markettime.blogspot.com to come and keep us on the educational track and teach us a bit about how to use option spreads to reduce risk.
===================================================================
Many market participants are conditioned to think of options as instruments of gambling and undue risk. In my opinion options should be regarded as what they really are: instruments of market participation. Like any other tool, it is the way we use them that can make them help, or harm us.
I sometimes use options instead of buying or shorting the underlying securities. As we know, options come with an expiry date, and a time premium that shrinks ever so faster as we get closer to expiration. So, timing is important. Also, it is important that one chooses an expiry date that would give enough time for the trade to play out.
Following is a trade I did a while back using put spreads to short the Biotech Holders ETF (BBH). I will use a hypothetical position size of 10 contract for simplicity of calculations but that is not the size of the actual position that I had.
On August 14, 2008, a TV commentator's remark on the biotech sector being hot and attracting funds caught my attention. I am a strong believer that when I hear something on TV, the story has already run its course. Not that financial pundits mean to deceive us, just that they, or at least most of them, pay attention to things like most of the rest of us - well past the half way mark if they are half good at what they do, right at the end if they are not.
A look at the BBH chart got me interested on the short side.
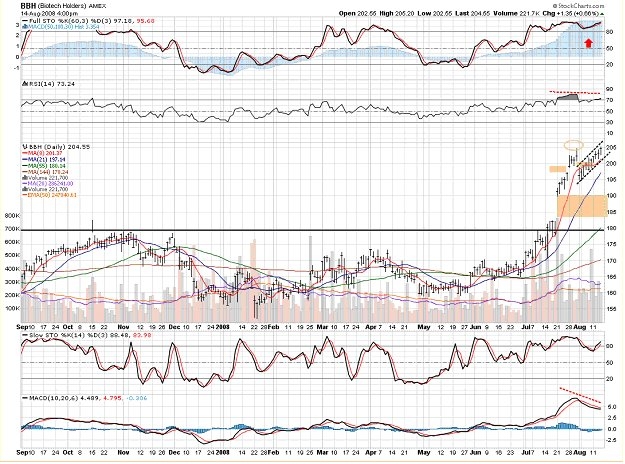
I noticed a few things
1. Price had a huge gap up in mid July
2. It followed through by another, smaller gap up, which was quickly reversed by a gap down, forming an Island Reversal.
3. The island reversal was ignored by bulls and price rose, but in a very tight slanted channel
4. The latest rise on the chart was accompanied by diminishing momentum, and volume
I liked what I saw for a short and decided to keep an eye on it.
My first thought was to see if I could find a leveraged short ETF on the Biotech sector. I could not find any. I am a member of a very active community of traders. I posted a question to see if anyone would aware of a Biotech short ETF. Instead of a simple Yes/No answer, I received detailed dissertations why it would be a bad idea to short Biotechs. This was my second contrary confirmation that I had a good shot on the short side. Not having been able to find an ETF to do the short, I decided to use put options.
A few days later, I got what I wanted
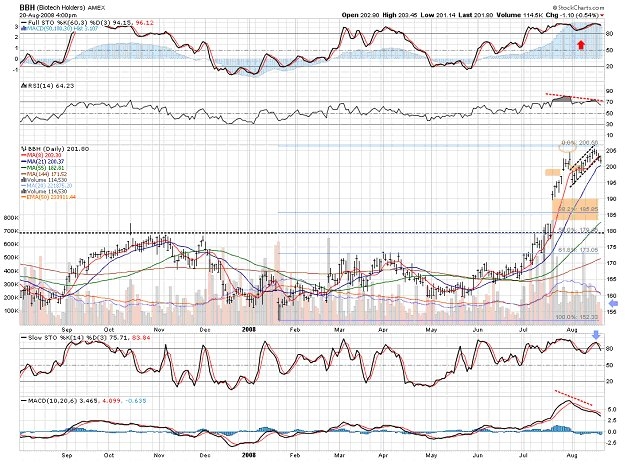
1. The rising channel broke
2. Stochastics gave a sell signal
3. Negative momentum divergences in place
4. Longer term momentum, at the top of the chart, showed signs of rolling over
Things are seldom perfect
1. Volume was lacking
2. price was on a first run out of a long term base indicating possibility of a mere pullback and not a total breakdown
3. Longer term MAs were pointing up
I decided to go on with the trade and buy some puts on BBH. But what puts? To decide on a strike, I first tried to come up with some target areas if the short would actually work.
1. There was the huge gap in 183-190 area
2. There was the top of rectangular base at 180 (that base had been 2+ years in the making)
3. 50% retracement of the up move sat right on the resistance line at 180
4. 32% retracement of the up move was somewhere in the 183-190 gap
I thought if I could get lucky, 180-185 area might define a drop target.
What option duration? Trying to give the trade a bit of time, I decided to buy Oct 185 puts. Before placing an order I defined on my exit rules:
1. Buy, sell, stop decisions were to be primarily taken based on price action of the underlying security and not the option price
2. If options were more than 1/3 in loss, the position would be closed.
For 10 Oct 185 puts at 1.25, I would have to pay 125 dollars a contract or 1250 dollars total. That would be all I could ever lose; if I could get to exercise my rules, I would actually lose 1/3 of that.
It so happened that the channel break signal that I took was a good one, and BBH started on its merry way down, all the way to this chart of Sep 4, 2008
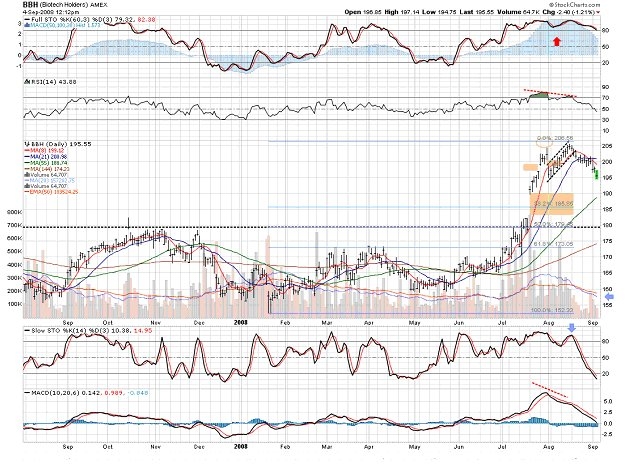
The puts that I had could now be sold for 2.20 for a net profit of 220 - 125 = 95 dollars a contract or 95 / 125 = 76%.
But, conservative and risk averse as I am, I still am a greedy trader. This chart looked like it was rolling over on a weekly basis. So I decided to do something different.
1. I would sell 30% of the position and take some profit
2. I would lay a spread against the remaining 70%
I could sell 3 of my puts for 3 * 2.20 = 660 dollars, bringing my cost down to 1250 - 660 = 590 dollars for remaining 7 contracts = 90.7 dollars per contract.
I could now sell 7 Oct 180 puts for 1.25 or 125 dollars a contract = 7 * 1.25 = 875 dollars.
So I would be out 1250 - 660 = 590 dollars on 7 Oct 185 puts
I would get 7 * 125 = 875 dollars from the sell of the Oct 180 puts.
That would give me a net profit of 875 - 590 = 285 dollars, or 285 / 1250 (original investment) = 22%
Not as good as 70% but still decent, and I was still in the game, free of cost.
So what could happen from then till Oct expiration day if I did nothing?
1. BBH could stay above 185, and all puts would expire useless. Then I would make 22%
2. BBH could drop below 180, then I would be put BBH shares at 180, which I would sell at 185 using my higher puts and would make 500 dollars a contract on top of what I had already made (best possible outcome)
3. BBH could stay between 180 and 185 at price x, then 180 puts would expire, and my 185 puts would be worth (185 – x) * 100 dollars per contract + what I had already made
4. A disaster could happen and all contracts could be declared void, I would still make 22%, that is, if the disaster did not adversely affect my bank.
This is a recent chart of BBH showing what would happen if I had, against all technical signs, followed the pundit on TV, or the traders on the board I mentioned above.
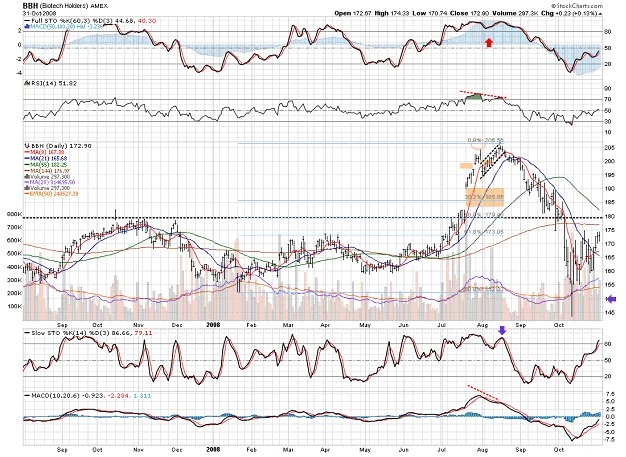
A combination of basic chart reading techniques, decent timing, and risk management using options can produce good returns against well-defined, limited risk.
About the author:
Behrouz Fallahi is an independent market participant who keeps an active blog at http://markettime.blogspot.com.

 Gary Anderson is a thirty-five year market professional. He is a principal of Anderson & Loe, Inc., a firm that provides technical consulting services to an international clientele of banks, mutual funds, insurance companies, hedge funds and independent advisors. Gary has published articles in Technical Analysis of Stocks and Commodites and is regularly quoted in the Wall Street Journal and Investors Business Daily.
 Spreads sometimes are touted as a no- or low-risk trading option, ideally suited to smaller or more risk-averse traders. Although some do have limited risk in certain circumstances, spreads are by no means risk free, and in fact they contain some unique risks, especially for traders who don't have a clear understanding of the limitations and possibilities of these transactions.
 Spreads occur between different months of the same contract for a variety of reasons. For many agricultural contract, the cost of storing and insuring the physical commodity from month to month (referred to as carrying cost) is incorporated into the price of the back months in relation to the nearby month or the cash price, and will account for at least a minimum price difference between two contracts.