Weekly Stock Market Forecast

This week we have a stock market forecast for the week of 9/5/21 from our friend Bo Yoder of the Market Forecasting Academy. Be sure to leave a comment and let us know what you think!

The S&P 500 (SPY)

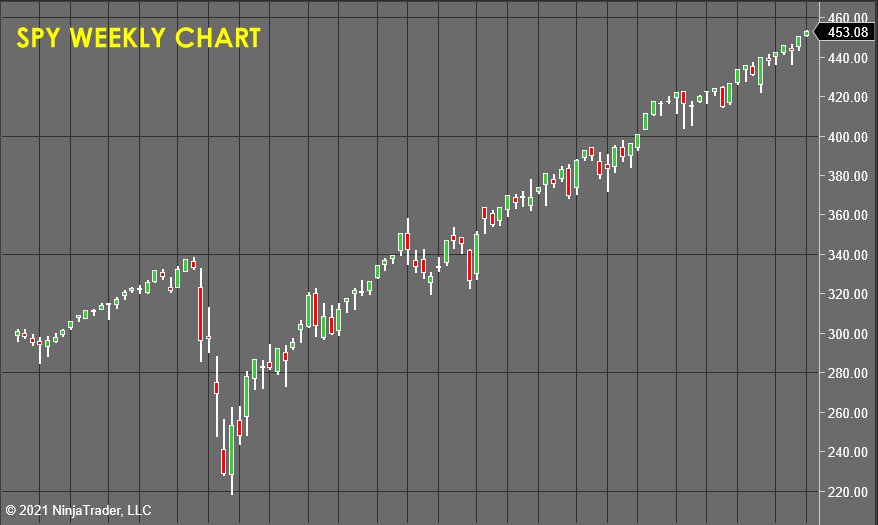
SPY Weekly Chart -Stock Market Forecast

A terrible hurricane that did billions in damage, yuuge flooding in Manhattan with 7 inches of rain...

And the S&P still stays in its coma.

Looking at this historic disconnected rally in the markets, I’m reminded of what it’s like to be deep in the woods of Maine. Continue reading "Weekly Stock Market Forecast"

Stock Market Risk Not Yet Realized

The stock market is at high risk, but…

The ‘but’ is the old saying “markets can remain [seemingly] irrational longer than you can remain solvent” if you fight a trend that is intact at any given point. Since March 2020 that trend has been up.

Structurally Over-bullish

Below is a chart showing the 10-week exponential moving average of the Equity Put/Call ratio (CPCE) that we review periodically in NFTRH for a view of the structural over-bullish situation in stocks. I write structural because it has extended much longer than extremes in the CPCE have done at previous ‘bull killer’ danger points, after which risk was realized in the form of moderate to severe corrections.

The trend began logically enough at a ‘bear killer’ reading in the midst of max pandemic fear. We noted at the time that market participants were not just bearish, not just risk-averse, but absolutely terrified. So the recipe is this: take 1 lump of terrified investors, add a heaping helping of the Fed’s money printing and voila, enjoy the taste of a slingshot rally that is very filling despite its inflationary odor.

Risk? Well, when SPX took out the previous 2020 high last summer we established a target of 4400 (conservative) to 4600 (at an extreme). The market is in the target zone, CPCE has begun to labor up and out of the structurally over-bullish floor and well, it could be a signal of a later stage bull market. But a warning about jumping into a heavily active bearish position is that using the run-up to 2016 as an example, the pressure can build for months, even years before risk is realized. Another caveat to going full frontal bear is that the EMA 10 is starting to hook down again as pressure is being relieved lately. Continue reading "Stock Market Risk Not Yet Realized"

Bitcoin and Gold Update: What's Next?

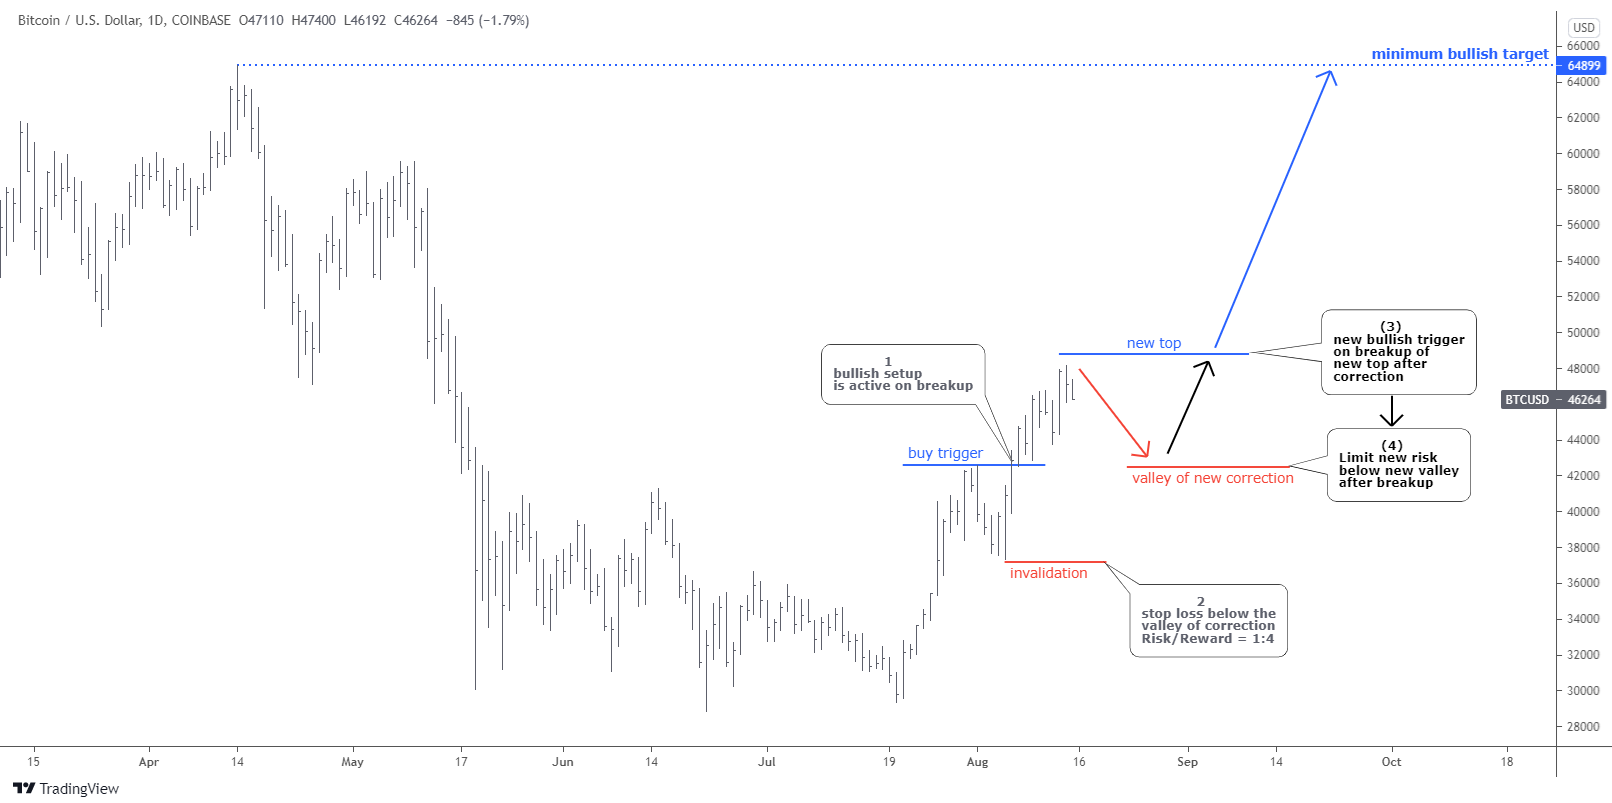
Bitcoin triggered the new buy setup posted last week.

Most readers confirmed that they see the new bullish opportunity in Bitcoin, and the largest part were ready to add or enter the new trade.

Bitcoin Daily Chart

The new buy setup repeated the first trade setup as the setback was not deep again as it only reached the same 38.2% Fibonacci retracement level.

The Friday brought the expected trigger above the previous Saturday’s top of $48,150. The setup is active now and should limit risk below the valley of correction to around $43,900. The risk/reward is good at 1:4, with the same target at the all-time high of $64,899. Continue reading "Bitcoin and Gold Update: What's Next?"

Bitcoin Buy Setup In Profit Range

It looks like I have posted the Bitcoin Bullish Setup at the right time as the price precisely followed the preset path - first down into a correction, which hit the minimum area of 38.2% Fibonacci retracement level. Then up to break above the first minor top, that activated the buy trade setup.

The majority of readers were bullish, with 61% votes.

Bitcoin Daily Chart

We can see the clear difference between outlooks and setups. I posted both the Bullish setup and the Bearish setup in case the correction would be extended. They were based on opposite outlooks. We do not have to guess; we wait for which setup would work. Continue reading "Bitcoin Buy Setup In Profit Range"

Copper Is On The Verge

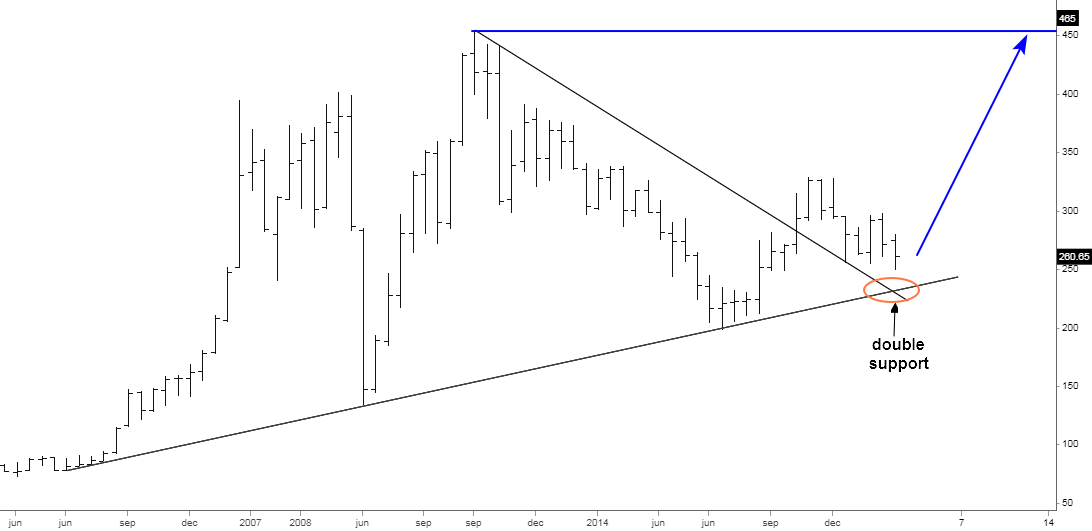
Almost two years ago, in my previous copper update, I called for a big jump of the metal’s price to an ambitious target of $4.65 in the quarterly chart. I put it below to refresh the memory.

Copper Chart

Firstly, the price collapsed to pierce the double support shown in the chart. Only after that, it quickly rebounded to the upside as it hit the preset target of $4.65 this May. I hope you enjoyed that long rally.

Another model, posted almost three years ago within an educational experiment advanced very well, although it did not hit the target yet, as did the pattern shown above. That charting exercise drew a lot of attention and feedback at that time. Moreover, the majority of readers bet on this well-known pattern. Continue reading "Copper Is On The Verge"