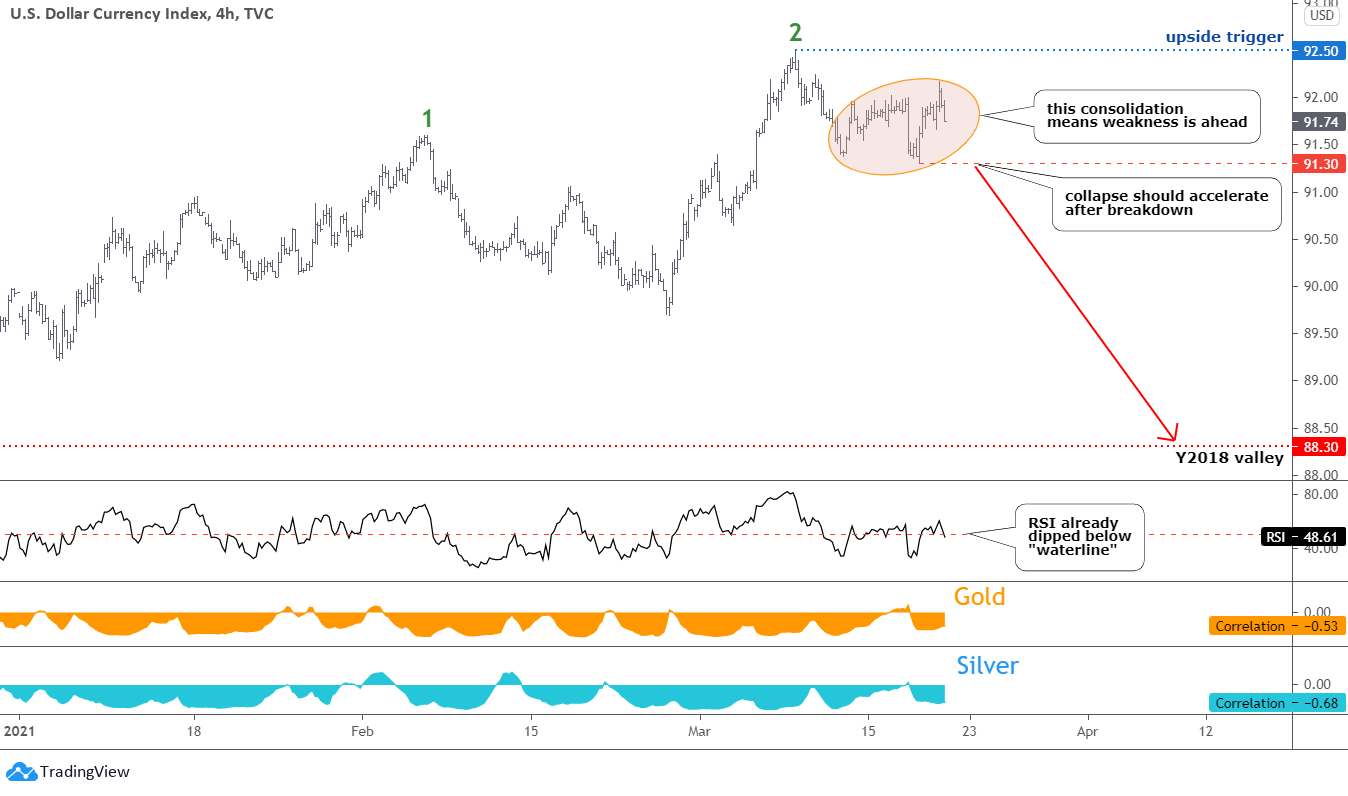
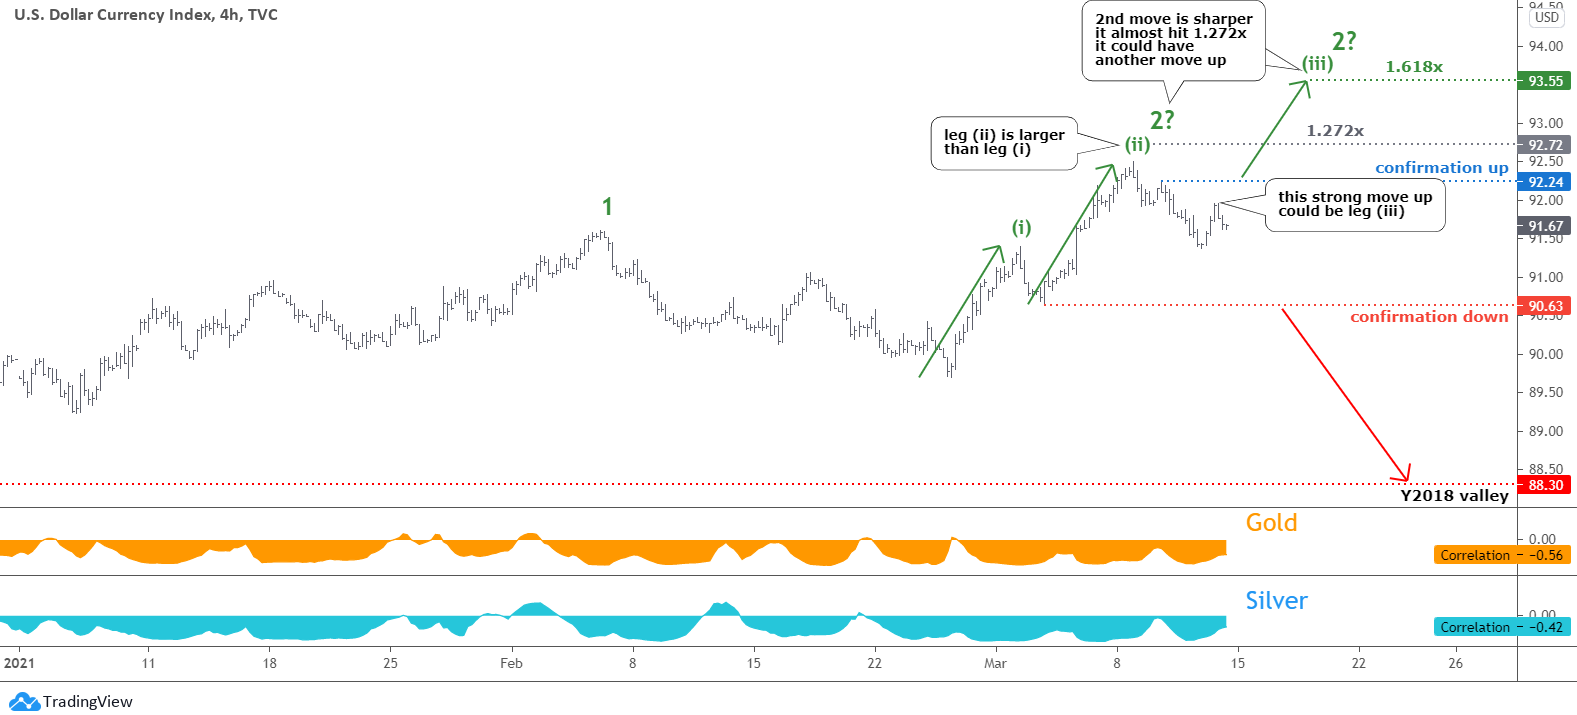
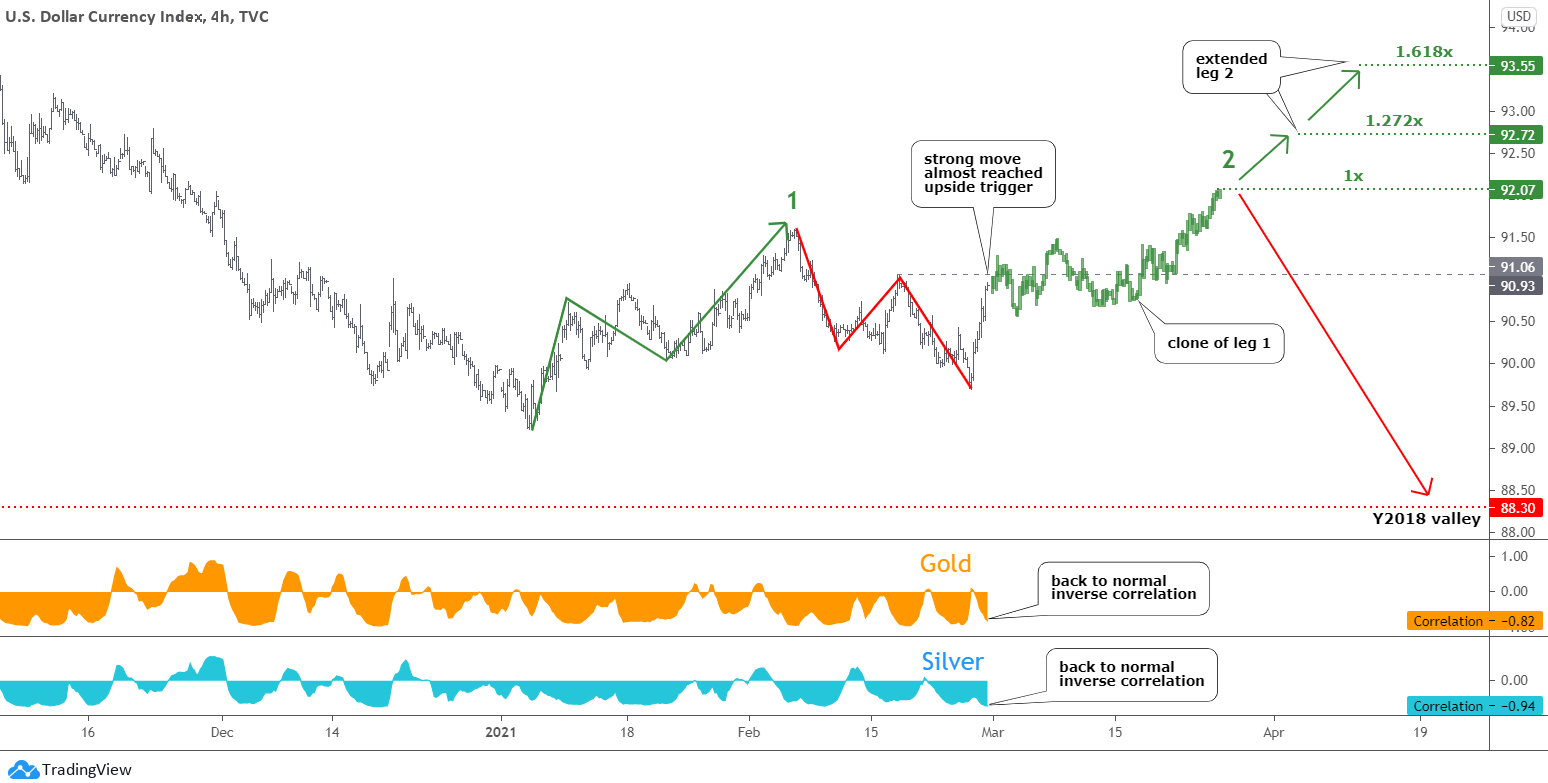
The U.S. dollar index (DXY), aka “King,” has a clear structure in its chart as it moves accurately according to the plan posted at the beginning of the month. Most of you supported the idea that the dollar will show another drop.
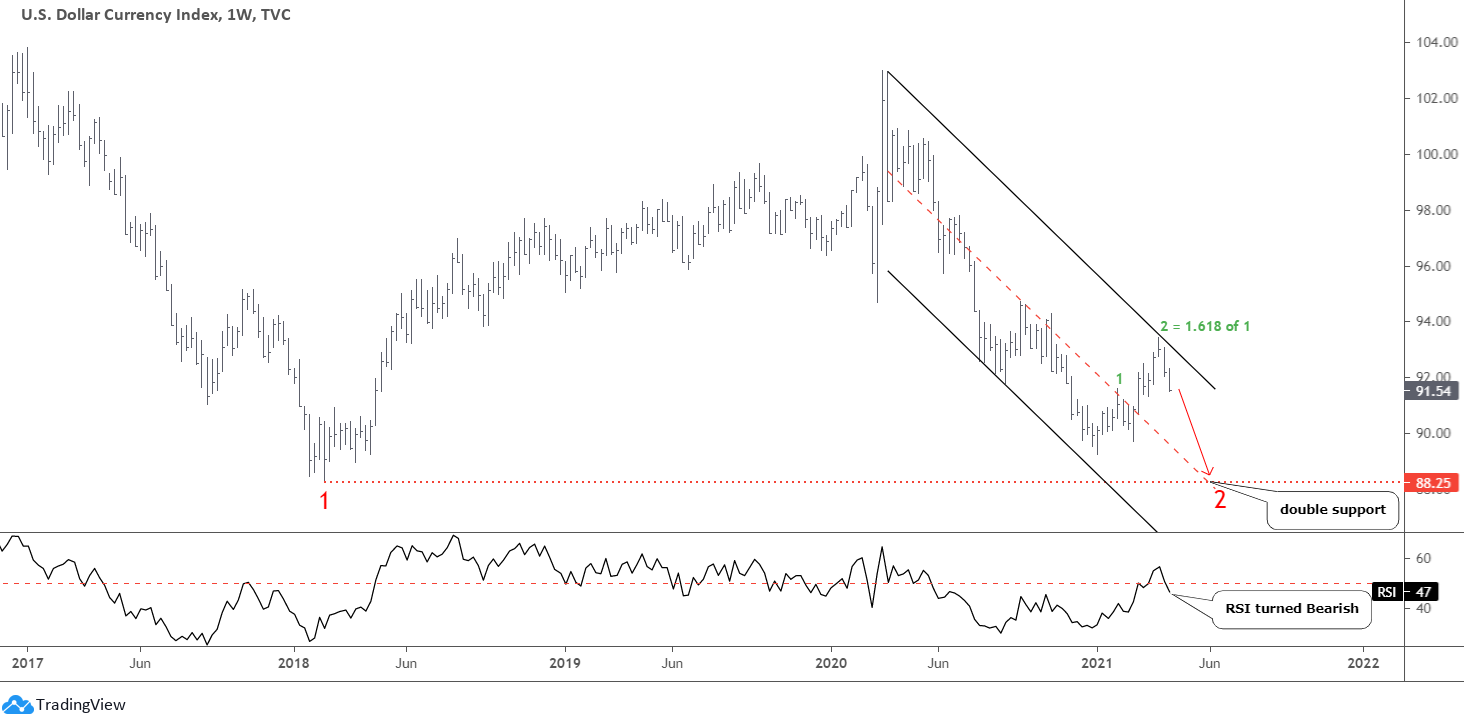
The green leg 2 of the pullback traveled 1.618 of the distance of the first green leg up and touched 93.44 at the top. Then, the price quickly reversed down to drop like a rock. The last week’s bar closed at the minimum as selling pressure persisted. I switched to a weekly time frame to show you how accurately the current second leg down repeats the path of the first leg down.
This time, after the price went deep down, I built the black downtrend channel through the recent peak. We can see the magic of the trend here as the mid-channel accurately intersects the valley of the first leg down at 88.25 to offer double support for the price.
The RSI turned Bearish following the brief roll over the crucial level. It confirms the downward outlook.
This predictability of the dollar dynamics made me reconsider the gold chart below. Continue reading "Gold & Silver: The Dollar Shows The Way"

