
Each Week Lo ngleaftrading.com will be providing us a chart of the week as analyzed by a member of their team. We hope that you enjoy and learn from this new feature.
While the markets are packed with data throughout the week, the most important numbers will come on Wednesday when the FOMC releases their Interest Rate Decision. We will also hear from the Bank of Japan later in the week, but that report is scheduled as tentative at this point. Aside from these two Central Bank announcements, we expect the scheduled data that includes unemployment, CPI, PPI, Industrial Production, Home Sales, and Retail Sales data to take a back seat.
Few economists or traders expect any change in Central Bank policy this month, but many will be focused on any language that would hint to upcoming changes in the near future. Some forecast a potential change in the month of December, when the FED may look to taper their monthly commitment to bond purchases.
It will be interesting this week to see if the NSA spy scandal has any affect on the markets overall. So far, most markets are continuing to trend with last weeks direction, but as more and more information is released, the market may be vulnerable to some profit taking.
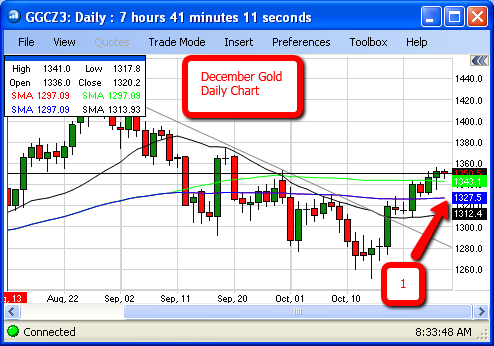
The Gold Futures begin the week trading slightly under the September 30th high but above most major moving averages. It wasn’t until October 22nd that December Gold Futures showed positive bullish momentum when the market pushed through the 200 day simple moving average (Blue Line) and tested the 50 day simple moving average (Green Line). Today Gold is using the 50 day as support, but is still failing to close above the September 30th high. I believe that as long as prices can stay above the 200 day simple moving average around $1325 an ounce (arrow #1), Gold Futures stand a chance to remain in a bull trend throughout the upcoming week.
If you would like to discuss trading in the Futures and Futures Options markets with me, please feel free to call or email me directly. You can reach me directly at (888) 272-6926 or by email at
bb****@lo*************.com
.
Thank you for your interest,
Brian Booth
Senior Market Strategist
bb****@lo*************.com
888.272.6926
** There is a substantial risk of loss in trading futures and options. Past performance is not indicative of future results. The information and data contained in this article was obtained from sources considered reliable. Their accuracy or completeness is not guaranteed. Information provided in this article is not to be deemed as an offer or solicitation with respect to the sale or purchase of any securities or commodities. Any decision to purchase or sell as a result of the opinions expressed in this article will be the full responsibility of the person authorizing such transaction.
It is interesting when I have called around for physical gold both in the Dallas, Tx and Kansas City, MO areas, physical gold and silver are still very popular. I don't think the futures are properly reflecting demand at this time.
much appreciated Brian. the indecisiveness of the markets is evident by the "green spinning top" as of yesterday. markets await an important meeting on tapering or basically on the lookout for any slight wording that could consider continued tapering by the FED.
Normally we found picture like Bull v/s Bear or Bear v/s Bull, but Since long, Considering Gold Chart, we can observed both surprising scenario like Bull v/s or Bull or Bear v/s Bear Bulls and Bears both found confused without any specific direction, so any sharp or major break-out of either side only can give any reliable and sustainable situation for any specific continuous trend.