
Hello MarketClub members everywhere! With the markets closed tomorrow for the Easter holiday, today is the end of the week. The question now is, how comfortable are investors going to be over this long 3 day weekend?
One of the tools I love using in MarketClub is the quarterly charts. I'm pretty confident in saying that very few traders ever watch these charts, but they should. They can provide you with a broad overall picture of the long-term trend that you just can't see on daily and weekly charts. I think you'll be surprised by what the quarterly charts are revealing today.
Below I have outlined last week's close, as well as key levels for the PSAR. Perhaps by the time you read this post the market will have already broken the Parabolic support levels. If that is the case, I would expect further weakness in the market next week.
DOW (INDEX:DJI)
Close last Friday: 17,602
PSAR level today 17,392.74
Monthly Trade Triangle: DOWN
Weekly Trade Triangle: UP
Conclusion: Trading Range/Sideline Position
S&P 500 (CME:SP500)
Close last Friday: 2,049.58
PSAR level today 2,030.45
Monthly Trade Triangle: DOWN
Weekly Trade Triangle: UP
Conclusion: Trading Range/Sideline Position
NASDAQ (NASDAQ:COMP)
Close last Friday: 4,795.80
PSAR level today 4,700.81
Monthly Trade Triangle: DOWN
Weekly Trade Triangle: UP
Conclusion: Trading Range/Sideline Position
In addition to the numbers above, I will be showing you some potential retracement levels for each of the major indices.
Gold (FOREX:XAUUSDO)
Close last Friday: 1,255 Spot Gold
PSAR level today 1,264.36
Monthly Trade Triangle: UP
Weekly Trade Triangle: DOWN
Daily Trade Triangle: DOWN
Conclusion: Short Position based on a red weekly Trade Triangle
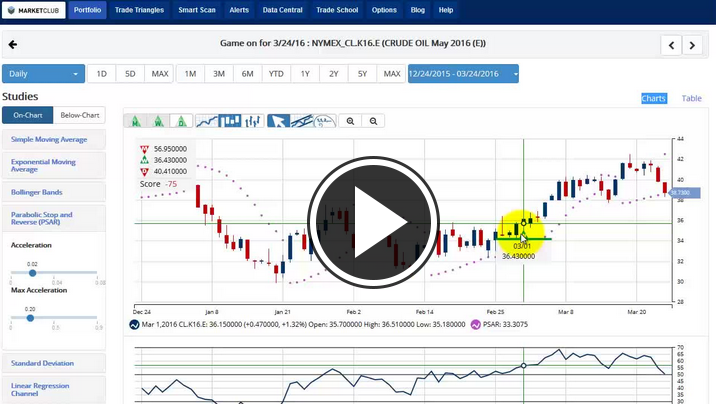
Crude Oil (NYMEX:CL.K16.E)
Close last Friday: 41.17
PSAR level today: 42.27
Monthly Trade Triangle: DOWN
Weekly Trade Triangle: UP
Daily Trade Triangle: DOWN
Conclusion: Trading Range/Sideline Position
As a member of MarketClub, you have a standing invitation to post your commentary. Our mission is to help you in any way we can to achieve your financial goals, so please take a moment to a comment or pose a question.
Have a happy and safe Easter everyone.
Every success with MarketClub,
Adam Hewison
President, INO.com
Co-Creator, MarketClub
Hi Adam, excellent video on using Quarterly charts..
As I'm new to analyzing your charts, could you share how the directional triangles(D, W, M) are derived.
Thanks,
J.
Hi, I read your article and i know you have good knowledge in Forex , Please tell me How I start invest in forex...
Hi Aimee,
Here's how you use the Trade Triangles to trade Forex – 3 Profitable Forex Strategies
For short term trading use the strategy below. Although it’s not our suggested method for the Trade Triangles for FOREX, Crude Oil and Gold it can be effective.
Weekly Triangles determine trend and possible entry points.
Daily Triangles determine timing: exits, entries and re-entries.
The last triangle issued on the weekly chart should always be used to identify the overall trend. You can also use the weekly triangle as a potential entry point if you can get into the market within the last 3 trading days of the signal. Then you are to look at the daily triangles for possible exit and re-entry points, or entry points if your weekly is in a steady trend.
Key Rule: always trade with the trend. Make sure your weekly and daily triangles correspond in direction.
*If you are a shorter term trader, it is possible to use the weekly triangles to determine overall trend and possible entry points and the daily chart to determine individual timing points. Please be aware of the short term whipsaws, and lack of overall trend strength.
As a short-term trader, you want to pay particular attention to the daily Trade Triangle (New 3 Day High/Low). If the Triangle is GREEN, you should then confirm the signals viability status with the weekly Trade Triangle (New 3 Week High/Low). The odds are in your favor that the trend will continue if both the Daily and Weekly light are both corresponding in color. If both Triangles are GREEN, then a positive movement is likely. However, if the Daily and Weekly Triangles are RED, then a negative movement is likely. If the Triangles differ in color then you should consider keeping a sidelines position.
How It Works
The Daily triangle is created whenever a market moves over the previous three day high and remains above the previous three day low. The reverse is true when the low of the previous three days is broken to the downside, it creates a RED Triangle. This is an automatic stop-out of a long position if the Weekly Triangle is GREEN. If the Weekly Triangle is RED, it signals a short sale is in order.
5 Successful Short-Term Trading Rules
1) The odds are in your favor when you trade with the major trend.
2) Always trade using stops. Never cancel a stop.
3) Plan your trade and trade your plan.
4) Never try to pick tops or bottoms, the market may surprise you.
5) Go with the flow. Don’t fight the markets.
Best,
Jeremy
Important question. Quarterly or two quarter charts are my preference. One thing to be conscious of is that it depends in part on the period of time the quarterly window is over. A quarterly window now extends over the Year end holidays. In US markets that includes a time of usual price patterns (the Santa Clause rally exists most years) and it includes the year end abnormally low volumes. To remove those effects I am now looking at a 56 day window, beginning Jan. 4
Dear Adam
I do agree with you about the importance of Quarterly Charts. However, these are giving quite late signals, but more reliable and confirm picture can be obtained only through this time frame. As far As indices are concerned, it has great results, with a very few chances to get adverse result then the Chart study predictions based on quarterly Charts.