

Last November I brought an experiment to your attention based purely on the laws of physics. I called it the "Pendulum experiment." The idea of it was to pick the strongest and the weakest asset by performance in 2015 and to check if they will move back like a pendulum and exchange their performance position relative to each other – the weakest will become stronger, the strongest will become weaker.
Just to refresh your memory: the Nikkei index was the top performer and Palladium was the weakest metal (YTD November 2015). I want to express my gratitude for the active participation in voting; the results are in the graph below.
Chart 1. Nikkei vs. Palladium Voting Results:
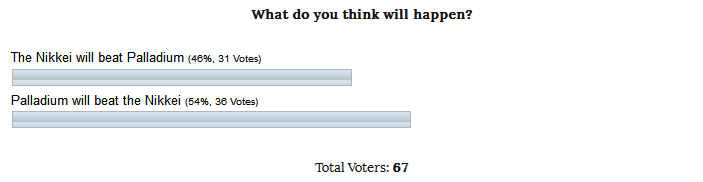
Poll results courtesy of INO.com
The odds were in favor of Palladium with a margin of 5 votes (8%). It was almost a split even bet and we have another couple of months to see the final results. Now let us check the current progress of the assets as we passed the halftime period.
Chart 2. Nikkei vs. Palladium: One Is Bad, Another One Is Flat!
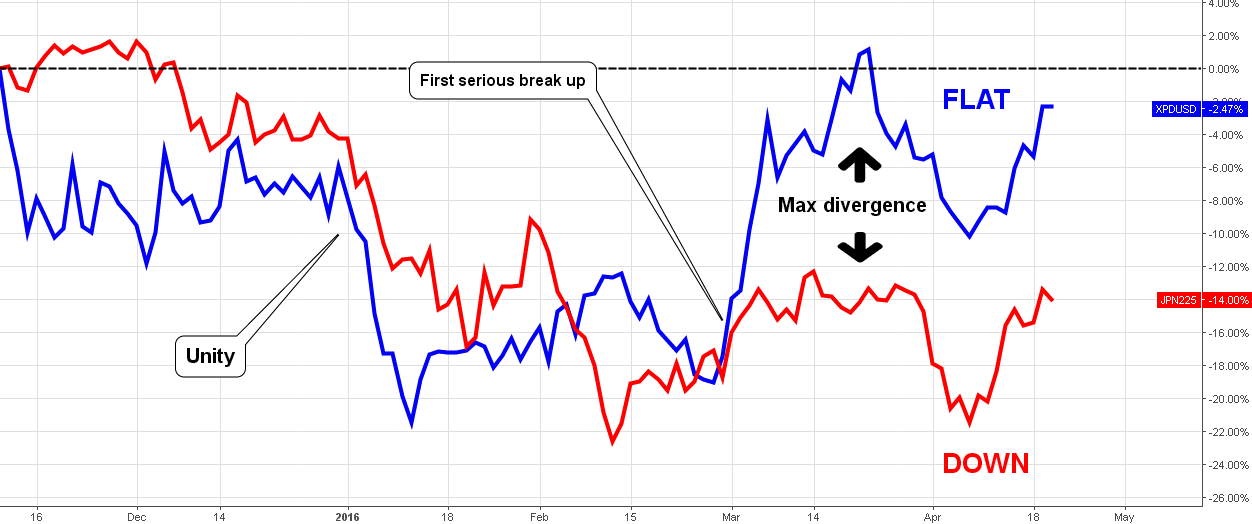
Chart courtesy of tradingview.com
Palladium had a very poor start to the experiment. It dropped to -10% same month and then stuck in a range with -4/-12% margins for the rest of the year. Another dip in January brought metal to -22% losses, but there was the bottom and palladium started to move upside. The next zigzag hit the zero point in March winning back all of the earlier heavy losses. I would call it a revival. Palladium's moves are very volatile due to low liquidity and I wouldn't recommend it for retail traders, better leave it to large players.
The Japanese stock index first moved slightly higher, but it appeared to be a running before the jump from the rock into the deep sea as divers do. The Nikkei didn't hesitate and moved straight to the bottom in February at -23%, a notch deeper than palladium did. The bounce up in March was temporary and the index almost hit the bottom again, but reversed to it's current -14%.
Both assets performed badly during the first half of the experiment. They almost both hit the same deep bottom area. But palladium surprisingly revived to the zero level and all-in-all has shown flat dynamics so far. The Nikkei couldn't pass through the -12% level and has double digit negative dynamics to date.
Let's look into the separate charts below for focus view.
Chart 3. Palladium Weekly: Upper Side
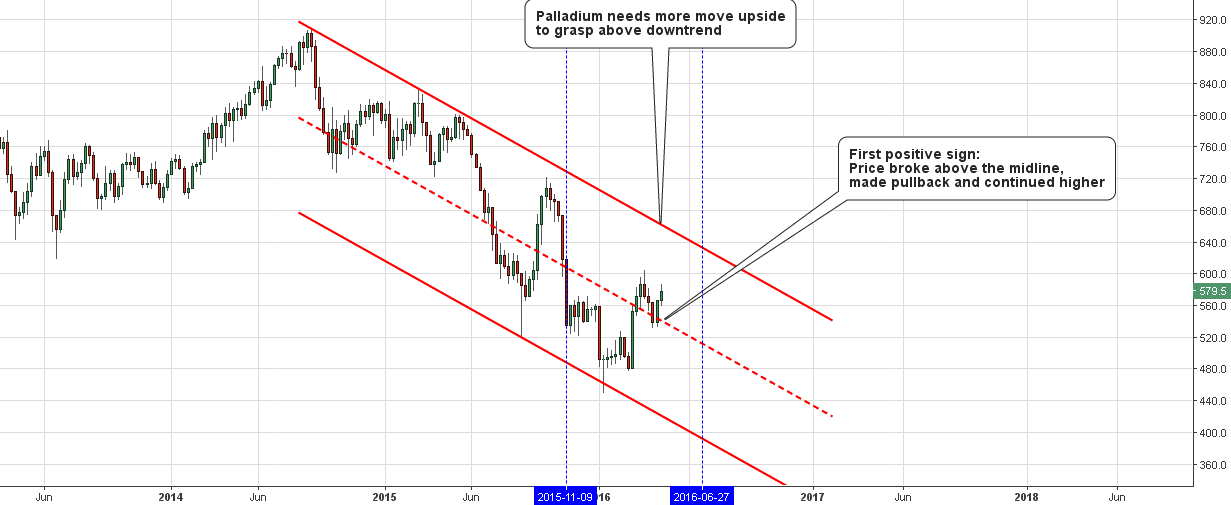
Chart courtesy of tradingview.com
Palladium is in the downtrend that started in 2014. I highlighted the experiment time margins with the blue dashed vertical lines to let you visually evaluate the remaining time. The metal broke above the red dashed midline of the trend, then made a pullback and continued to the upside. This is the first positive sign for palladium to get above the zero point at the $597 level and unconditionally beat the Nikkei. The metal should pass through the upside of the falling trend above $670 to change the midterm game.
Chart 4. The Nikkei Weekly: Lower Side
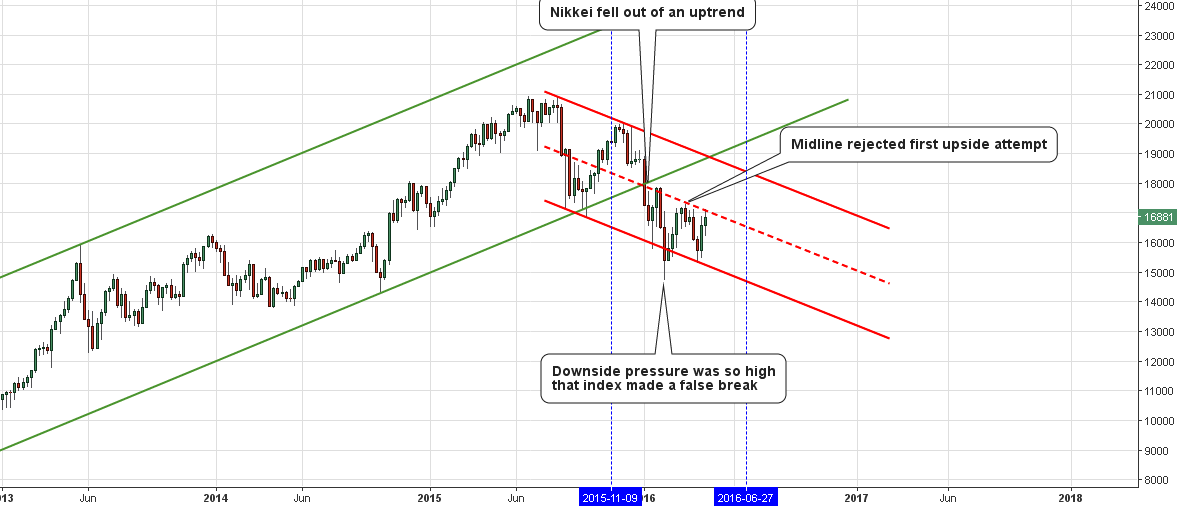
Chart courtesy of tradingview.com
The Japanese stock index looked very well at the start. I assumed a low probability of the strong green uptrend break down. And now we are below it. The drop was quick and violent as the price dipped 1000 points below the red downtrend. But it was a false break and the Nikkei gained back a hefty 2500 points. The index dropped back from the stiff resistance at the red dashed midline. This week we see the second attempt to crack it. The Nikkei is almost 3000 points below the zero point, but we have two months to go to sum up and the Japanese stock index can still beat the palladium.
Let's live and see what this experiment will show us at the end in July.
Intelligent trades!
Aibek Burabayev
INO.com Contributor, Metals
Disclosure: This contributor has no positions in any stocks mentioned in this article. This article is the opinion of the contributor themselves. The above is a matter of opinion provided for general information purposes only and is not intended as investment advice. This contributor is not receiving compensation (other than from INO.com) for their opinion.