
At the beginning of this month, I shared a warning alert as the silver chart had a Bearish divergence. The trigger was set below 50 on the RSI. It wasn’t activated, and gold and silver moved higher. Moreover, silver finally hits the target. The majority of readers kept a bullish outlook and got it right.
I prepared an update for you with the bonus chart at the end, so stay tuned.
Let’s start with the daily gold chart.
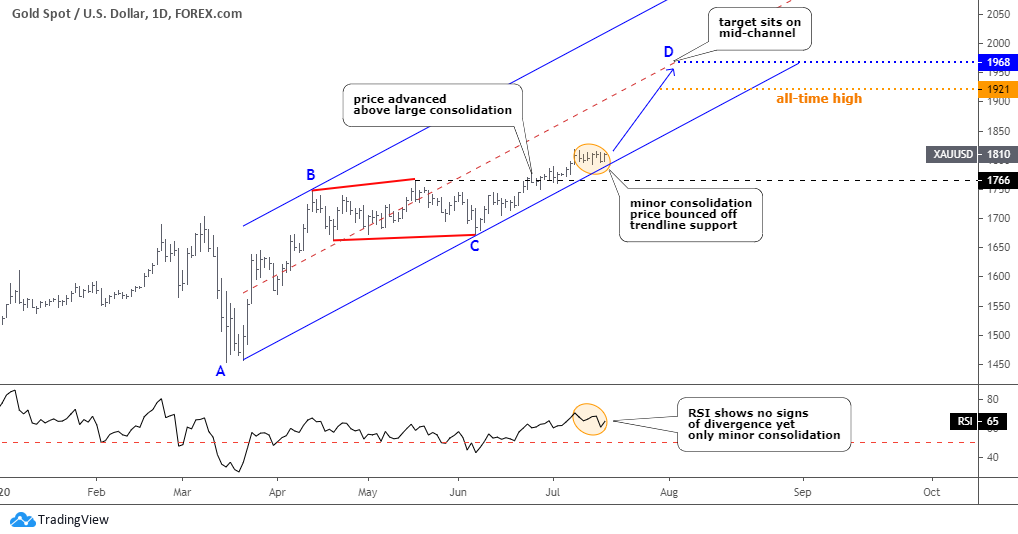
Gold is slowly moving to the upside. It hasn’t shown any bearish signs as of yet. The metal finally elevated above the top of the preceding large consolidation beyond $1766 (black dashed line), eliminating the option of another leg down within an even more extended consolidation.
On the 8th of July, the price hit a new multi-year high of $1818. Then the progress stalled with see-saw moves inside of a minor consolidation between $1818 and $1791 (orange ellipse). The RSI sub-chart also shows the zigzag down of a limited amplitude. I built the blue uptrend channel through the valleys of March and June. We can see that the price is crawling on the back of trendline support. Last Friday, the gold bounced off that support. Watch for the RSI to stay above 50 if another leg down appears.
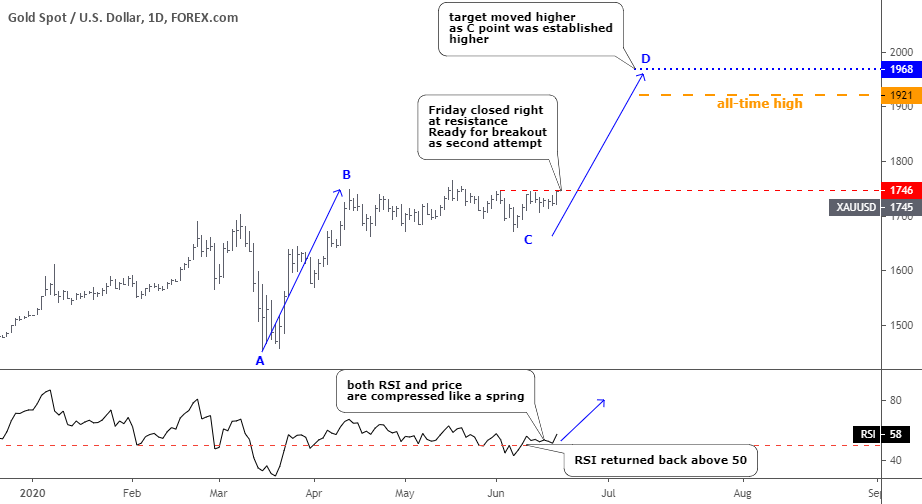
The target was updated a month ago. The C point remained intact, and so did the target of the D point at $1968. The all-time high level of $1921 could be strong resistance on the way up.
The updated daily silver chart follows.
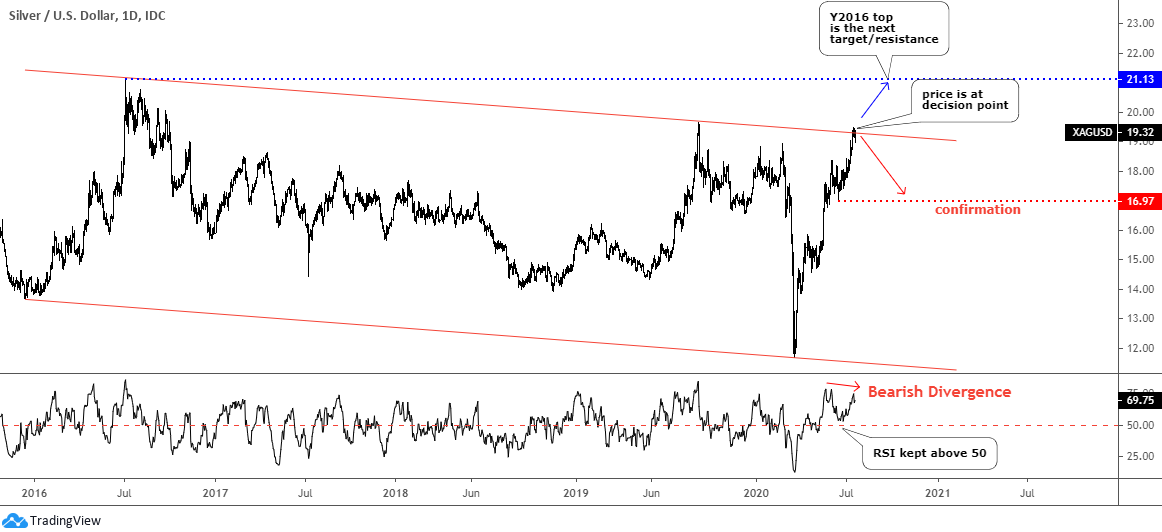
Silver has been the buzz maker since March as it sharply broke below $12 and then quickly restored all losses approaching the former point of reversal at $19.65 these days. The RSI kept above 50 on the drop during earlier consolidation. It fueled the price growth as it broke above the former target of $18.94 and even reached another hurdle – the upside of the red downtrend channel.
The price feels that red barrier as it stalled there for the whole last week hovering around the $19.3 mark. It could be a decision point as the price could reverse here to the downside as this metal reached all preset targets already. The new multi-month maximum wasn’t confirmed with the RSI as it has a lower reading compared to the previous top building the Bearish Divergence.
The divergence could postpone its effect for some time, but the time bomb is already ticking. As long as the price is above the low of the previous consolidation at $16.97 and the RSI is above 50, there is a chance the price could continue higher to reach the next target of $21.13, where the Y2016 top was established. Watch the price to break above this small consolidation beyond $19.50.
How come silver could diverge with gold as the latter looks to the upside, and the former has two different options? The last chart below could address this question.
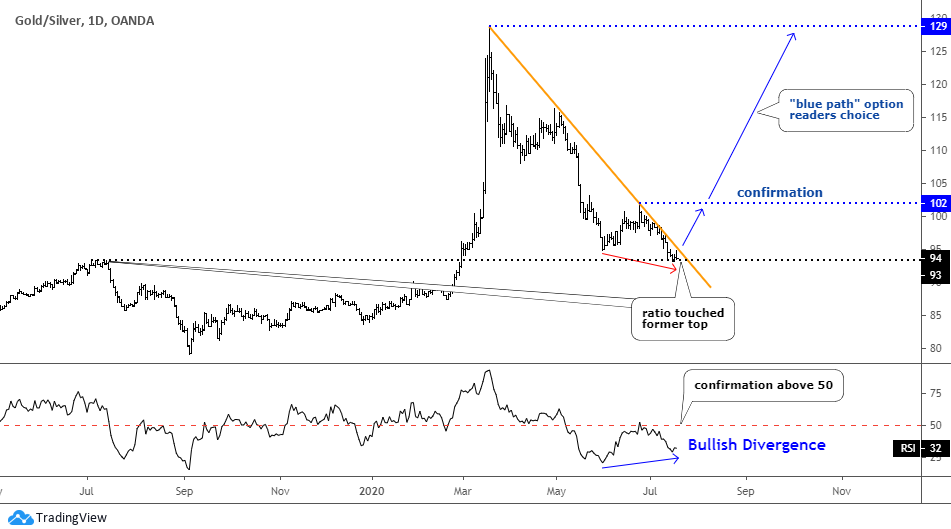
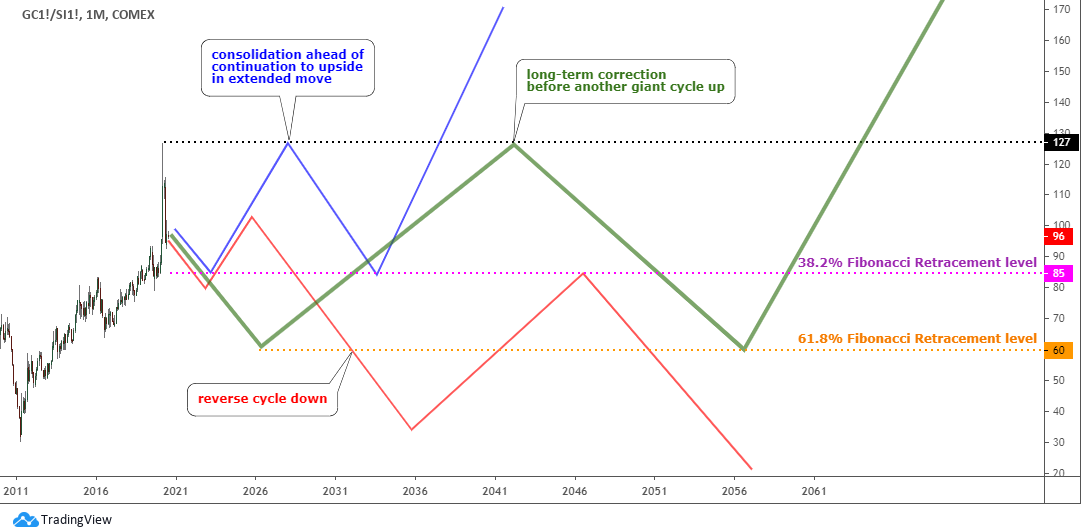
The gold/silver ratio has lost a lot since it hit the all-time high close to 130 oz level this March. It reached the former top, which was established exactly a year ago at 93 oz. This area could provide strong support for the ratio as well as the RSI indicator. The former didn’t confirm the lower valley, which was established on the price chart showing a Bullish divergence. Such a situation usually appears at the end of the move ahead of a possible reversal.
The ratio should break above the orange trendline resistance first as it nears that barrier. The confirmation will come with the break above the other top at 102 oz and when the RSI will overcome the crucial 50 level. The possible target is quite ambitious as it is located at the former top of 129 oz with almost 40% gain.
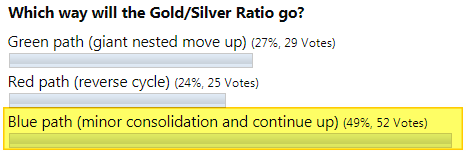
In my earlier post about the ratio, I showed you several options for the price to emerge. The majority of you chose the blue path of a minor consolidation and continuation to the upside (see snapshot below). The first leg up from that option was reflected in the chart above as it implies the retest of the former top.
If the reversal on the gold-silver ratio’s chart above will play out as planned, then silver would naturally hand over its leading role to gold. It means that the forecasted rally in gold could be muted on the silver chart, and the latter will take a pause or even make a reversal as we got the make-it-or-break-it option there.
Intelligent trades!
Aibek Burabayev
INO.com Contributor, Metals
Disclosure: This contributor has no positions in any stocks mentioned in this article. This article is the opinion of the contributor themselves. The above is a matter of opinion provided for general information purposes only and is not intended as investment advice. This contributor is not receiving compensation (other than from INO.com) for their opinion.
Silver to $25!
Dear Ed, thank you for sharing!
Are you sh!tting me? When gold pops, SILVER will follow. Since SILVER is mostly a derivative metal (mining wise) no one will be able to get it cheap with stock (PAAS aside). Since no one can actually get their hands on physical gold, where do you think silver will go? The divergence will be in the LONG direction of SILVER.
Your friend,
Dave
My dear friend David,
The divergence took place many times, especially when the ratio rocketed beyond 100 oz. The rest arguments are strong, it was my pleasure to read it. I would add here a fear factor as it is so strong that we went beyond all time high in the ratio.
Have a wonderful week ahead! Aibek