
Before I start this update about the dollar, gold and silver, I would like to show you how accurate your prediction was for the S&P 500 back in October of 2020! At the time, I demonstrated to you the well-known Cup & Handle pattern in the making. That model was promising as the target was set at an ambitious $3891 level. Let us see it again below to refresh the memory.
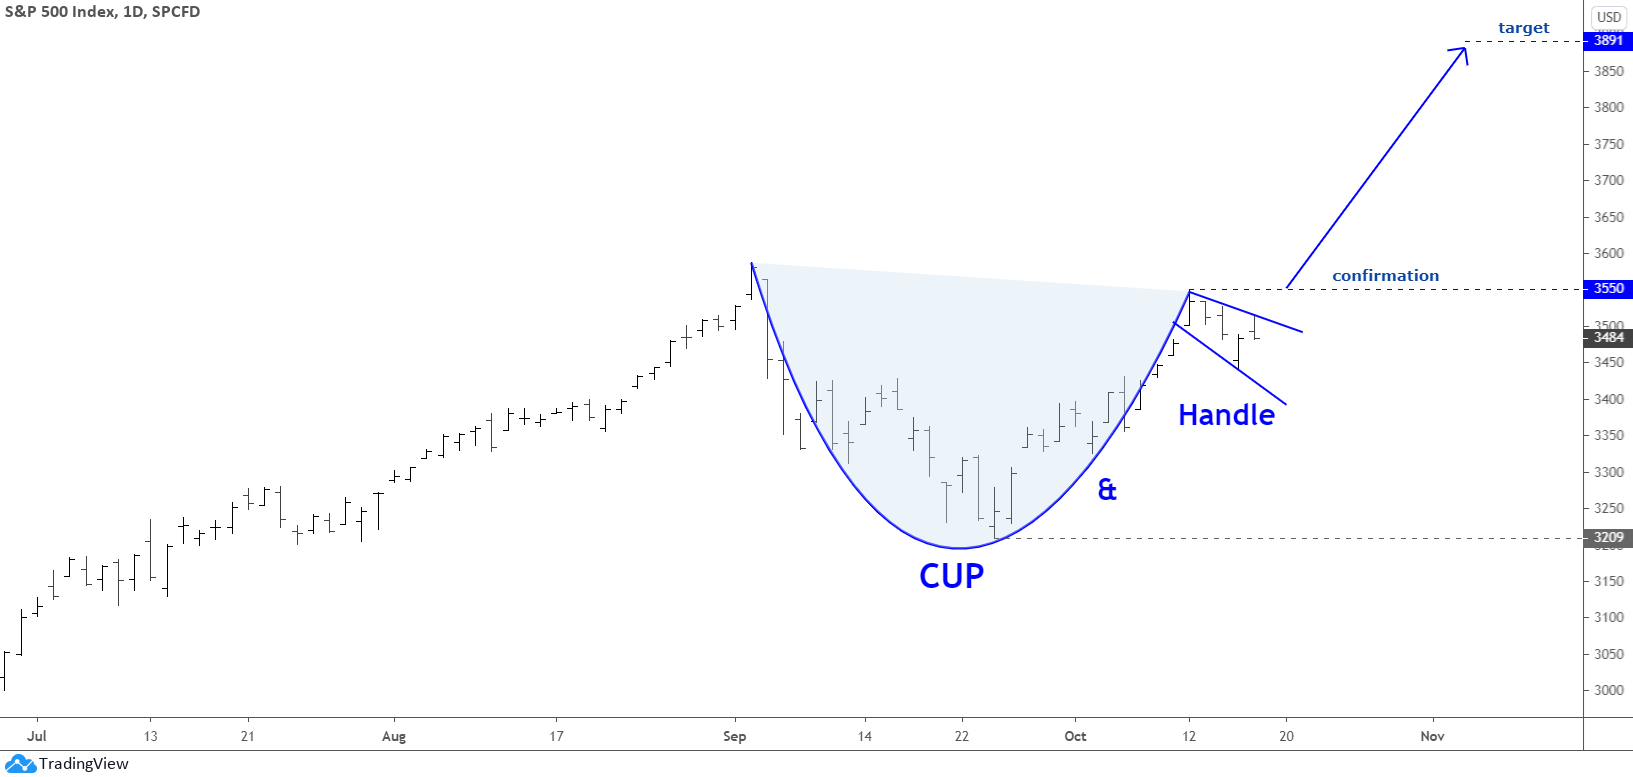
When I asked your opinion, whether this pattern is valid and will play out, most of you replied positively and supported my target. Let us see in the updated chart below how it played out.
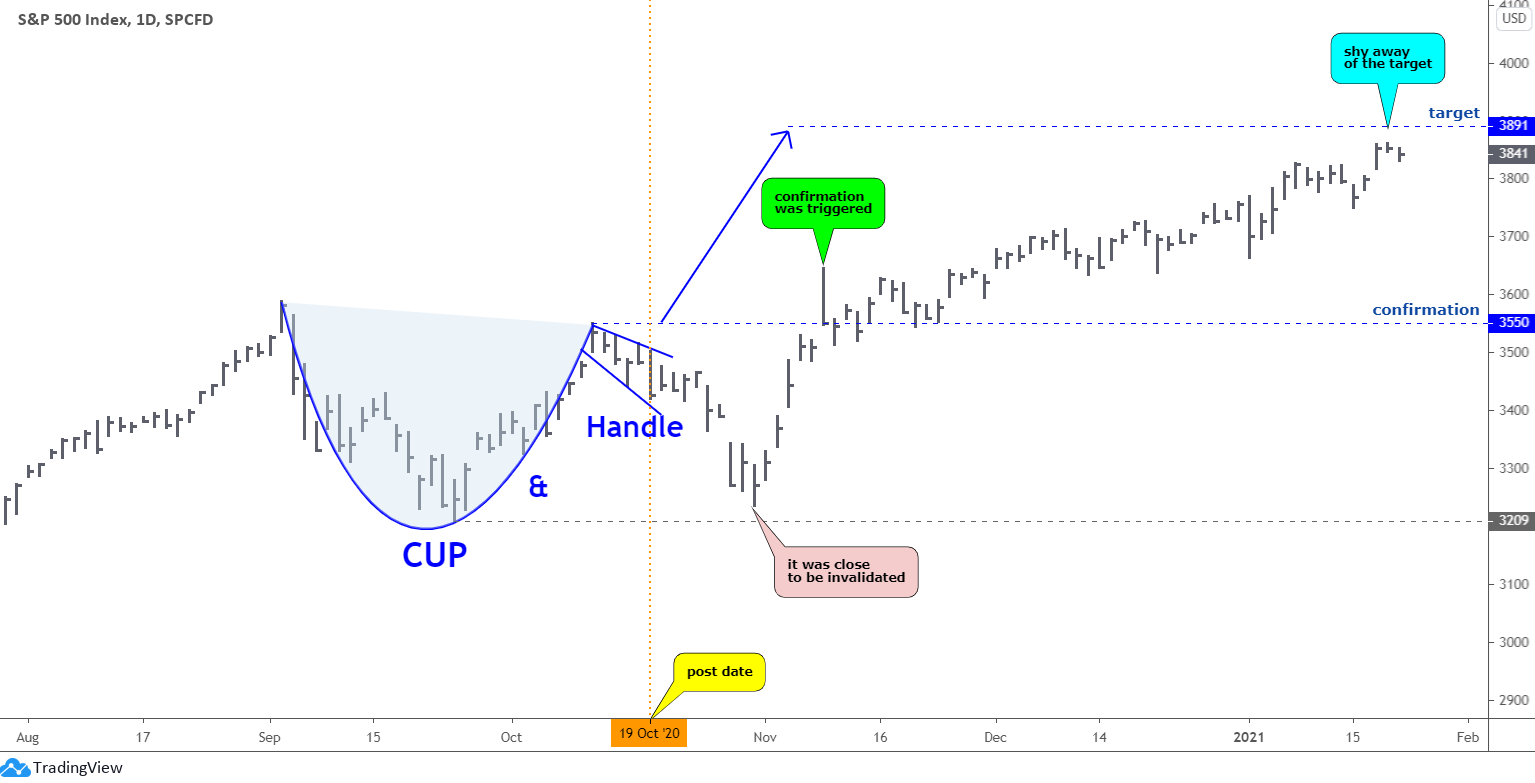
Your "crystal ball" worked perfectly as the new record maximum established last Thursday at $3860 had been just $31 below the target. The price action was not straight to the target as after the post, the price dropped quite deep, and the whole model was close to invalidation. Luckily, the further reversal built the "no look back" upside move.
This proves the importance of a confirmation trigger that could keep your nerves safe. After it was triggered in November 2020, the price was only twice slightly "under the water," Since then, the gradual growth brought a hefty 9% of the profit. My congratulations!
Now let us get down to a regular update as the King will open it.
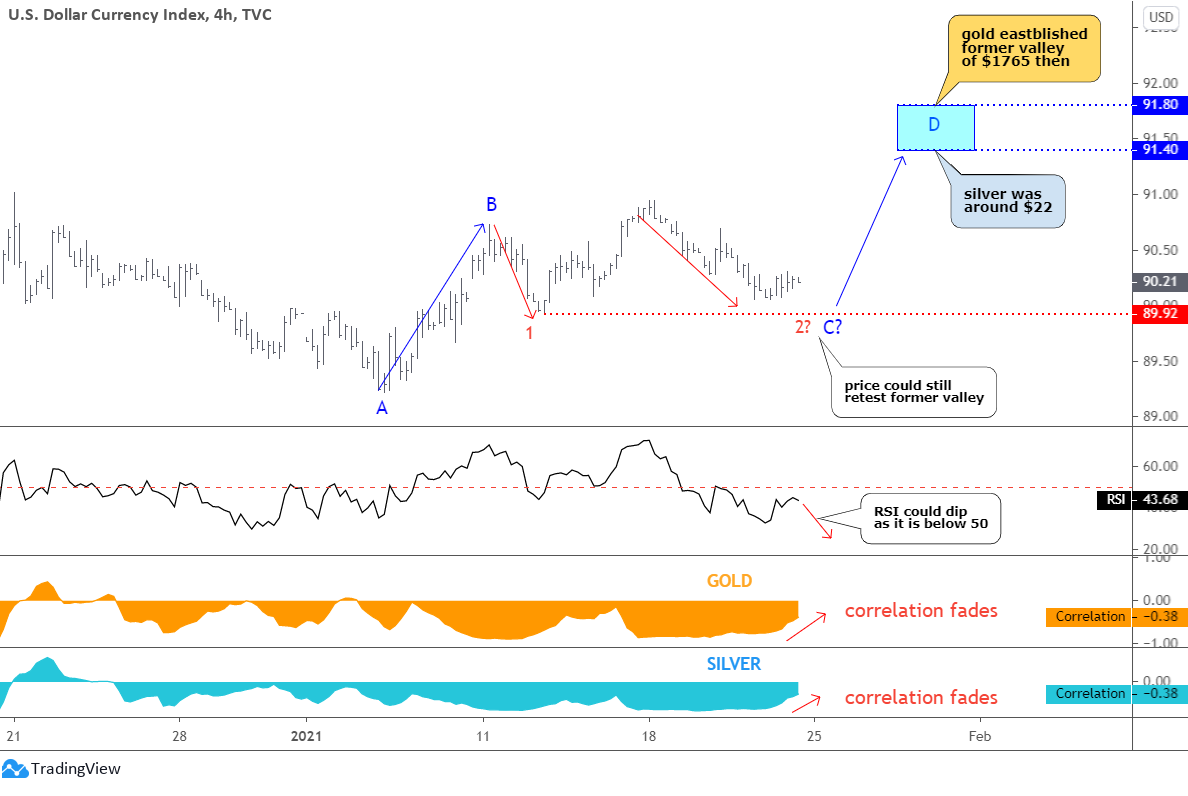
The U.S. dollar index (DXY) accurately followed the plan posted last week. The red leg 2 down started higher and moved as forecasted to the downside. It was not apparent last week as the King was on the rise. The knowledge of the structure gives us this edge.
My #1 Rule: Don't Buy Options (especially in this market)!
Most options traders place high-risk trades, hoping for a big payout. But they lose... a LOT! Especially in today's topsy-turvy market. That's why Jim Fink flips options trading on its head, making money more than 85% of the time. Now, he's offering to show his personal strategy guide to readers, which could help you unlock as much as $67,548 in extra income.
The recent move down did not tag the former valley of the red leg 1 and turned higher. The thing is that the red leg 2 already traveled a longer distance than the red leg 1, and this could be enough to complete the junction. However, the price could still retest that support at 89.92 as long as the RSI is below the crucial 50 level. Hence, the starting C point of another leg higher is in doubt. Nevertheless, the whole structure remains intact, and I kept the blue box as a target area. The majority of you chose the conservative target of 91.4 last week.
Now, let us look at the correlation sub-charts with precious metals. We can see that the correlation fades and eyes the neutral position. The reason is that these instruments' market price actions could lag between each other. The dollar index did not emerge the uptrend yet, while the precious metals are already sinking. It is a clear but possibly temporary de-sync.
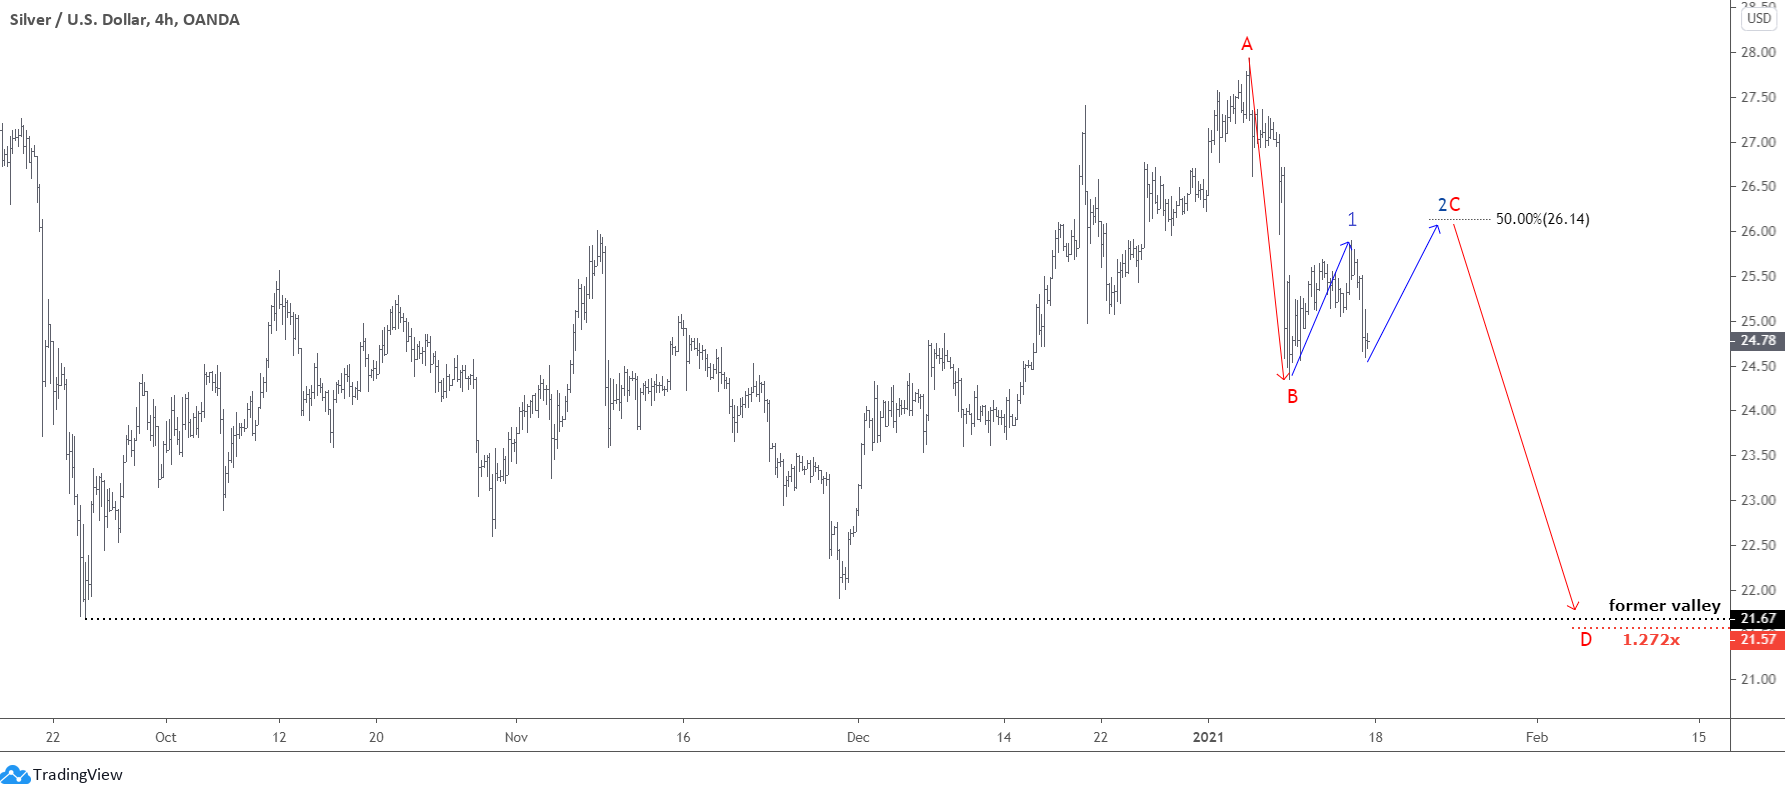
The silver daily chart follows with a clear structure.
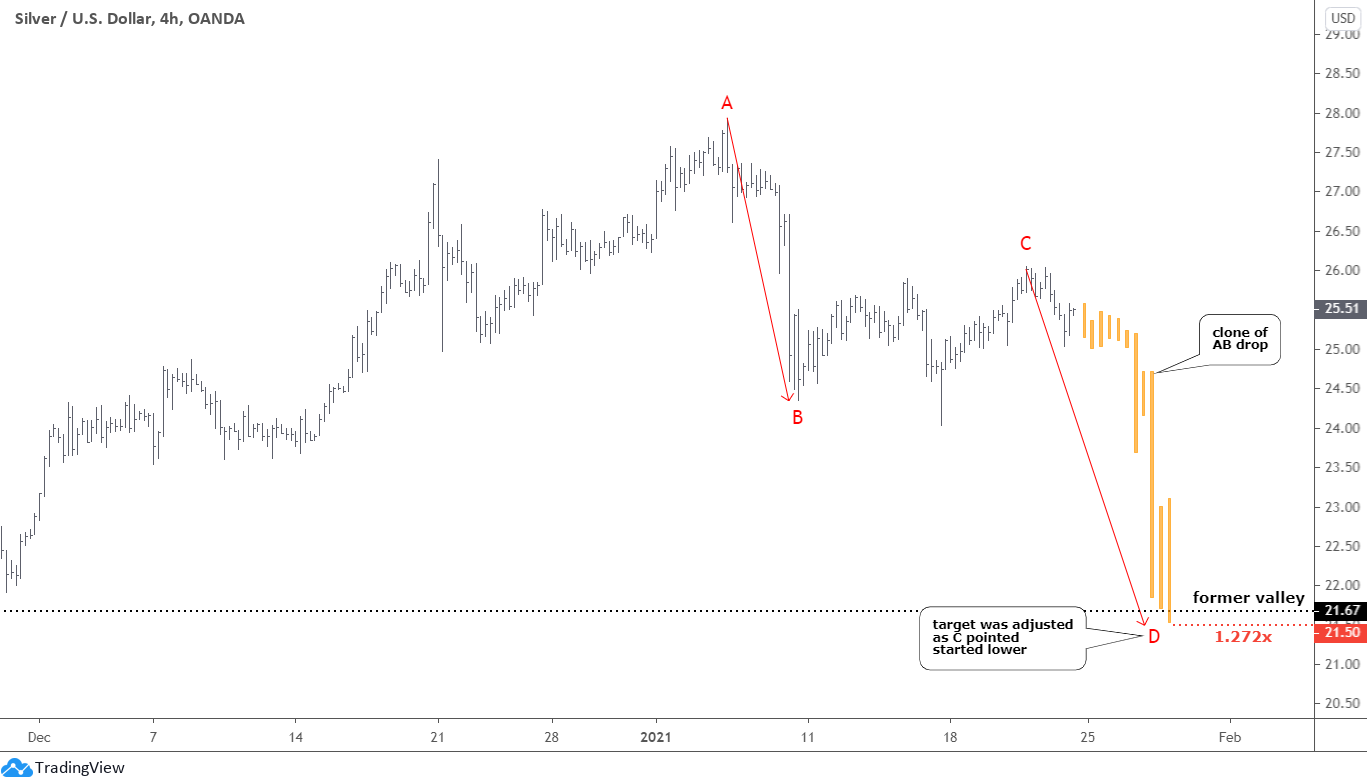
Silver moves in line with expectations posted last week. The C point was established around 50% Fibonacci retracement level as planned. I have adjusted the D target lower to $21.5 since we have the exact location of the C point. There is not a big difference as it is still in the area of the former low at $21.67. This one should be tagged finally to let the silver finally spread the wings and fly high.
I added the orange clone of the AB drop to visualize the path down.
Last time you bet that this metal will drop to $21.67 to complete the structure.
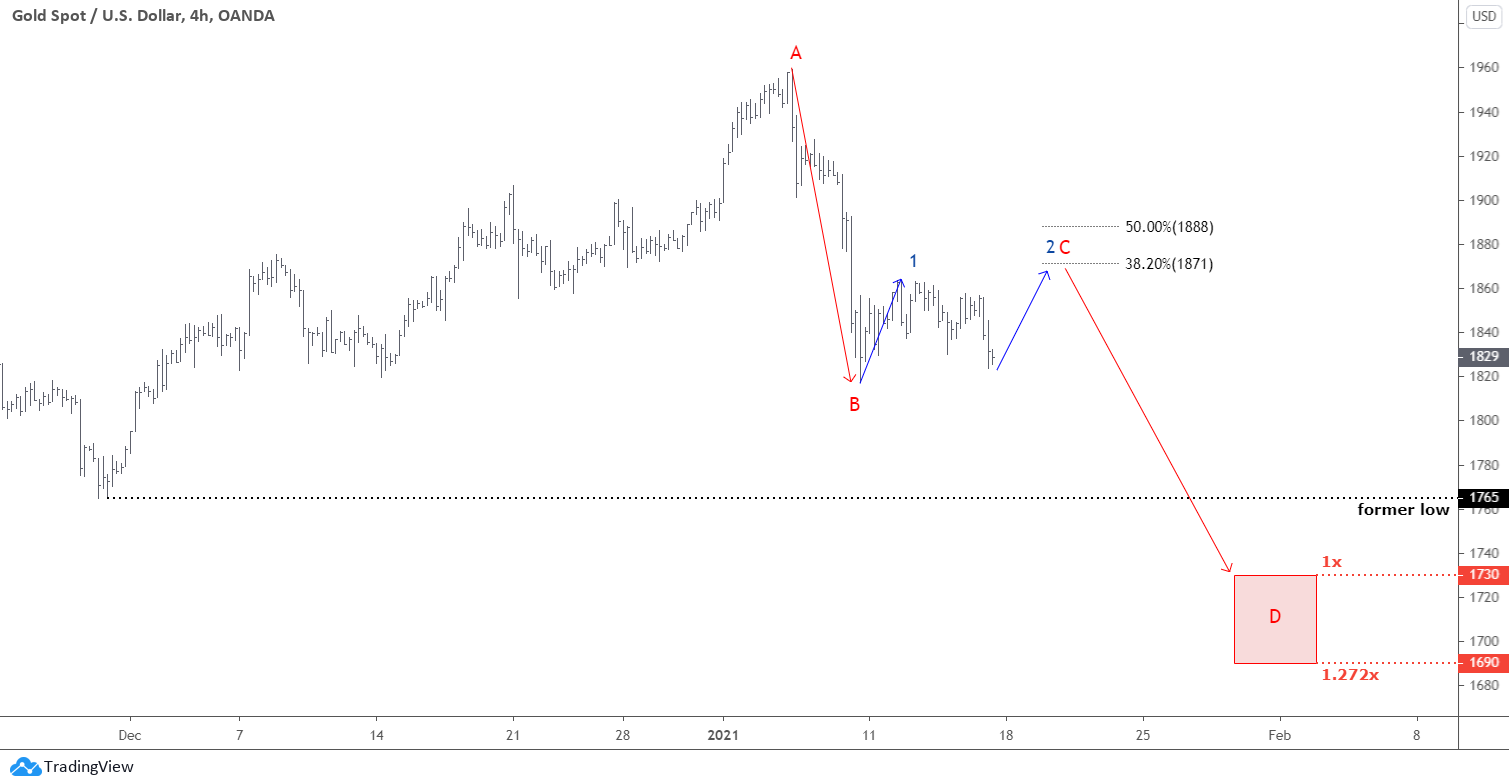
Now, let us focus on gold as it could surprise us with the set of two opposite options.
You can see two dominating colors in the chart above. The red annotations show the path to the downside as it is just an updated plan posted last week. Gold precisely follows it as its price reached and slightly passed over the expected 38.2% Fibonacci retracement level and then reversed to the downside. This overshot translated into the slightly higher target area of the red box between $1694 and $1733.
Most of you bet that gold would drop to tag only the former valley of $1765. I added the orange clone of the red leg 1 to show you the internal structure of the red leg 2.
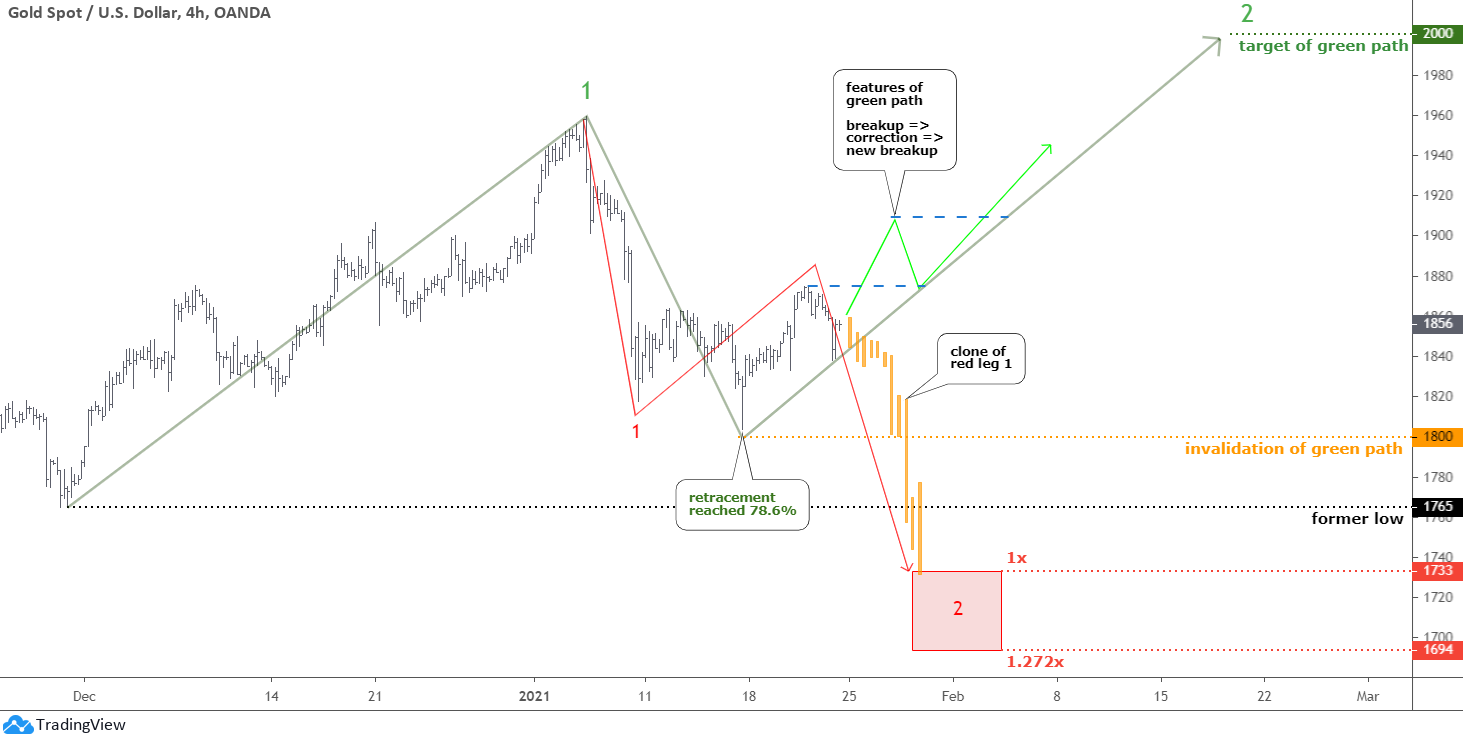
Earlier, you surprised me with the major choice of the green path of the Rising Wedge pattern that was posted at the beginning of this month. This time I added your favorite path in the gold chart above in the same green color. We have a 4-hour time frame here; therefore, this is just a part of the pattern.
The move up that kicked off on the last day of November 2020 and finished on the sixth day of this year is labeled green leg 1. Then we saw the pullback that was quite deep to hit the 78.6 Fibonacci retracement level at $1803. The critical point of the growth of $1765 was not violated, and this could support the next move up in the green leg 2 with a target of $2000.
The green path should not break below the recent valley around $1800 to keep intact. I also added the features that could help us identify if the green path is in progress. The bright green zigzag to the upside shows the possible structure. The price should first break up the top of the consolidation above $1875 (left blue dashed resistance), and then the small retracement should follow. The next breakout (right blue dashed resistance) to the upside is the final confirmation.
Intelligent trades!
Aibek Burabayev
INO.com Contributor, Metals
Disclosure: This contributor has no positions in any stocks mentioned in this article. This article is the opinion of the contributor themselves. The above is a matter of opinion provided for general information purposes only and is not intended as investment advice. This contributor is not receiving compensation (other than from INO.com) for their opinion.