
Last month I spotted a “Repeated Bullish pattern” of another Cup & Handle model.
The majority of readers confirmed that they see it either. Most of you supported my outlook of an extended Handle with another zigzag to the downside. This was the right guess. Let me show it to you in an updated chart below.
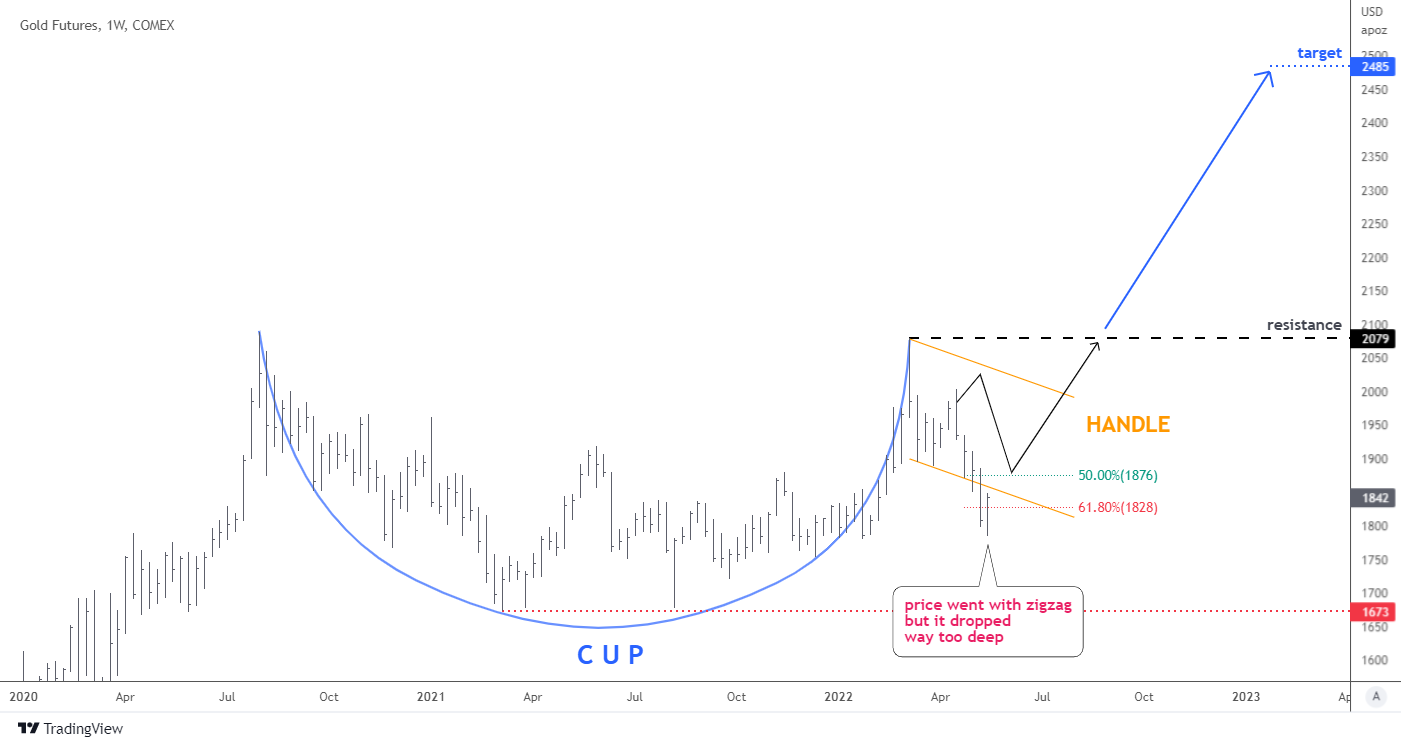
Indeed, the gold futures price followed the black zigzag on the chart to the downside. Hence, the outlook played out as planned. However, the depth of the drop was excessive as it hit below the expected valley of 50% Fibonacci retracement level and even 61.8%. The collapse stopped only close to four-fifths of the Cup. The classic approach would invalidate the pattern in this case.
The window of opportunity is still open for gold bulls as the current consolidation could change its shape from the Cup & Handle model to another well-known pattern.
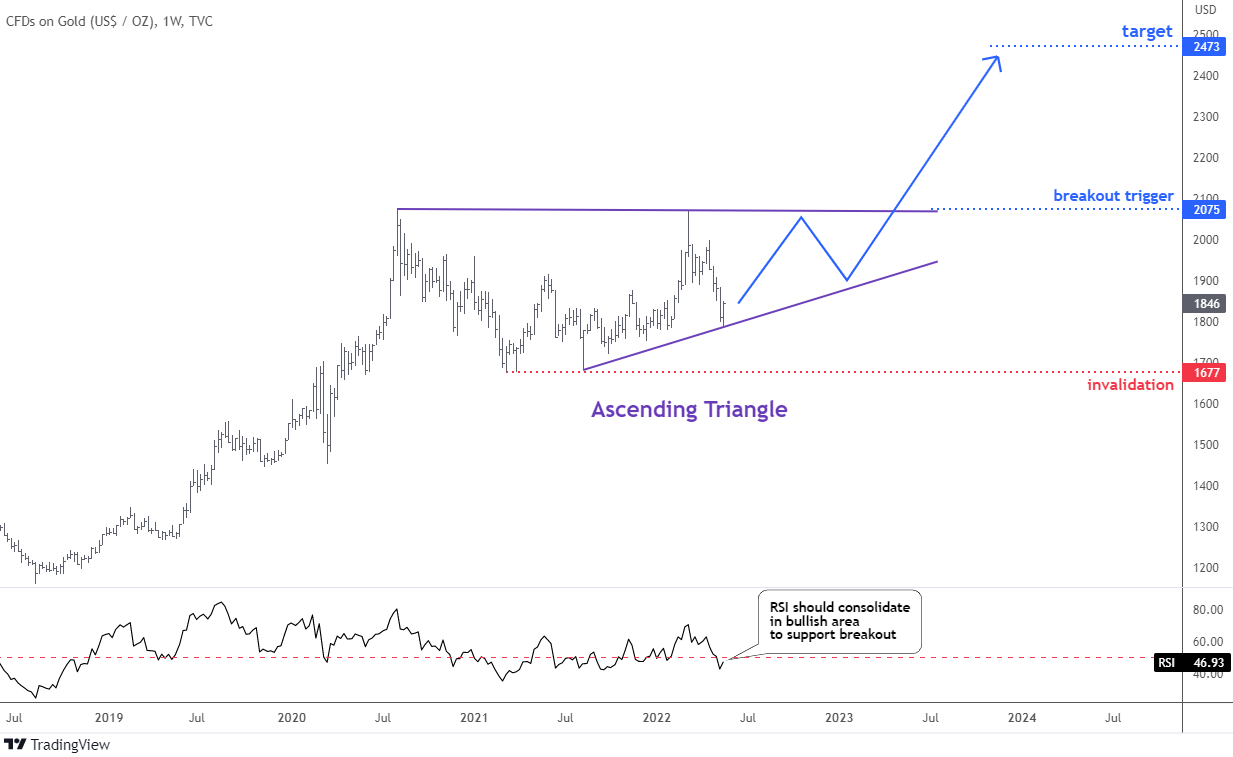
The combination of a flat topside and the rising valleys forms the Ascending Triangle pattern (purple). The recent bounce of the gold price marked the second touch point ($1,787) for the support line.
The price could make another zigzag up and down (blue) before heading to the breakup point. The latter is located at the all-time high of $2,075. The target is located at the maximum width of the pattern added to the trigger point and aims at $2,473. We could see the similarity with the earlier Cup & Handle pattern in terms of target and trigger.
The invalidation point is located in the valley of 2021 at $1,677. It will be moved higher once the projected zigzag is completed to limit the risk at a higher valley inside of the pattern.
The RSI flirts with the neutral line around 50, reflecting the current indecisiveness of the market. However, the indicator should consolidate in the bullish area to support the breakout.
I want to share another chart below as a reminder, which is quietly emerging in the background. One day, it could play out not in favor of gold. This could be the last window of opportunity for gold as the process has kicked off already, and it is projected to get even more impulse.
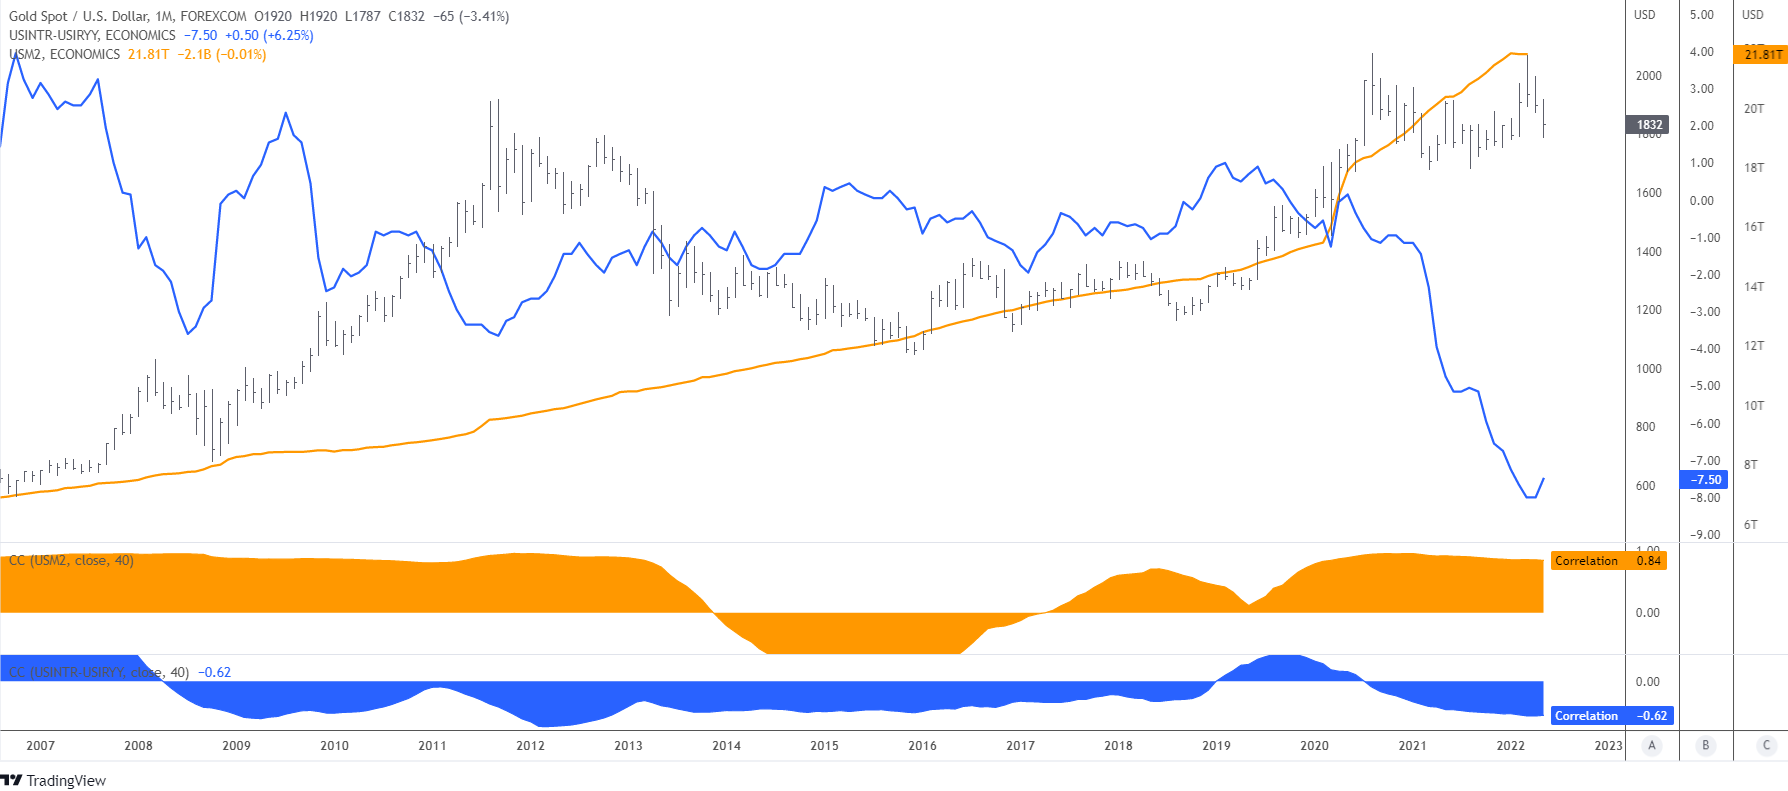
I already showed you the influence of the U.S. M2 money supply indicator (orange) on the gold price this January. The price of gold stopped right on the top of the M2 and could not break beyond it in the recent second attempt. Recently, the M2 has been relatively stable, as it has dropped only about thirty billion since the start of the year.
This time, I added the correlation indicator (orange) underneath to show you that the current positive link of the M2 is still very strong with the gold price at 0.84, which is almost absolute.
The blue line shows the real U.S. interest rate. We could notice that during the collapse cycle of this indicator from +3.95% in 2006 down to negative -3.65% in 2011, the price of gold more than tripled from $600 up to $1,921. In addition, from 2011 to 2019, the real interest rate had grown from a negative reading to the top of +1%; this resulted in the suppressed gold price in the range of $1,046-$1,300.
The correlation indicator (blue) shows the strong opposite correlation of the real interest rate at -0.62 with the gold price.
The Fed started the tightening and the question is only how far it could go. In my experiment with the interest rates this month, the relative calculations brought me to the double-digit rate of 11.5% for the Fed rate, which looks unbelievable these days. The majority of readers chose the half of it as a maximum.
The flat or falling M2 with the rising real interest rate looks like the mouth of the giant beast, which is going to close and “chew” the gold price trapped inside. The crossover point of the gold price with the real interest rate is around $1,200, which is a huge collapse from the current level. I shared this scenario last March in the “Wake-Up Call For Gold.”
Only restarting the money-printing machine and the inflation surpassing the tightening speed could cancel this scenario.
Intelligent trades!
Aibek Burabayev
INO.com Contributor, Metals
Disclosure: This contributor has no positions in any stocks mentioned in this article. This article is the opinion of the contributor themselves. The above is a matter of opinion provided for general information purposes only and is not intended as investment advice. This contributor is not receiving compensation (other than from INO.com) for their opinion.
Speculation is constantly re-evaluated & nothing is certain till it forms