
Since my last major update in November, the gold futures price has increased by almost 12%. At that time, most readers had chosen the bullish target of $2,089, where the price would retest the all-time high.
The gold futures chart is due for an update as it has reached a significant point in the current retracement following its recent peak at $1,975.
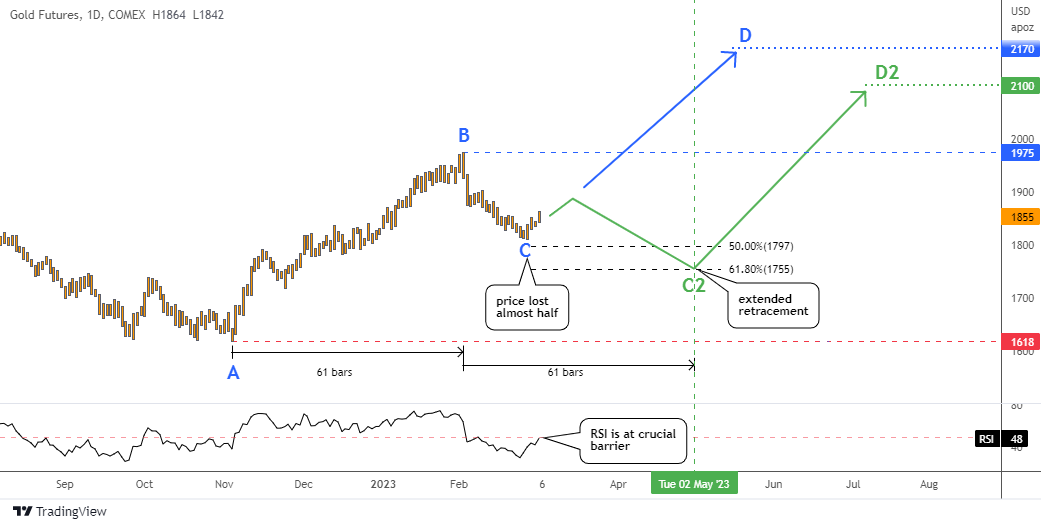
The gold futures price had been steadily rising for three months from the start of November until the beginning of February, where it reached a top of $1,975.
However, the market was hit when the “Jobs Report Dropped A Bombshell On The Markets”, which caused a significant drop in the value of many assets, including gold.
The recent price action in gold futures has been notable, marked by a sudden drop of $100 at the beginning followed by a slower decline in pace as the price retraced almost 50% and hit $1,811 by the end of February.
The question is whether this loss of half of the preceding rally is enough to consider the current bounce as a reversal.
In the chart above, two scenarios have been outlined for gold futures. The first scenario is represented by the blue CD segment, which suggests an immediate reversal in the straight move up, covering the same distance as the AB part. The target for this move is around $2,170.
In addition to the blue scenario outlined in the chart, there is another potential path marked with green annotations. This scenario suggests an extended retracement, with the current price growth seen as a temporary "dead cat bounce" that may lose momentum and lead to another leg down towards the 61.8% Fibonacci retracement level at $1,755. The RSI should fail or make a false break as it reached the crucial 50 level.
One observation that supports the green path is that retracements often take the same amount of time as the preceding move, and sometimes even exceed it in duration.
The current retracement reached only 1/3 of the preceding rally, which lasted for 61 bars. If we add another 61 bars to the blue B point, the green C2 point should not start until the beginning of May.
The potential for more aggressive Fed tightening also supports the green path, as the market could drop again if interest rates are raised close to 6%. The market may pause to wait for more jobs and inflation data, as the pace of these factors could provide more clues about the Fed's rate peak.
The potential for a deeper pullback also implies a lower target for the green D2 scenario. In this case, the price may only reach the area of the previous all-time high, which is around $2,100, rather than surpassing it. This level was your winner of the November ballot.
Six years ago, in March 2017, a similar situation occurred in the gold chart, as I pointed out in my post titled "Gold & Silver: Half Is Enough?" The retracement at that time also reached 50%, and two scenarios were presented, just like in the current post.
In the following chart, you can see how it unfolded back in March 2017 and whether history could repeat itself.
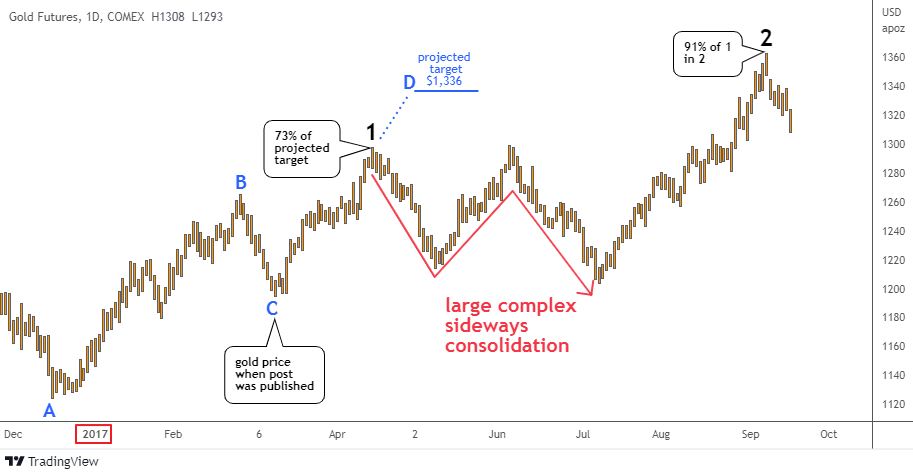
In 2017, there were two potential scenarios for the gold chart retracement, similar to the current post.
The blue scenario saw the establishment of the C point at the 50% retracement level of the AB segment, followed by a straight rally up along the blue path, with the price surpassing the B point. While the rally showed promise, it stopped short at 73% of the projected target, reaching $1,297 instead of the expected $1,336.
However, in the unpredictable market, a rally that exceeds the B point and covers more than half of the projected path could be considered successful.
Looking back, we can adjust the markings on the chart, as I have done with black 1 and 2, to indicate the actual segments that occurred, including the red two-legged complex consolidation in between. Ultimately, black 2 traveled 91% of the distance covered by black 1, which confirms the updated black labeling.
Intelligent trades!
Aibek Burabayev
INO.com Contributor
Disclosure: This contributor has no positions in any stocks mentioned in this article. This article is the opinion of the contributor themselves. The above is a matter of opinion provided for general information purposes only and is not intended as investment advice. This contributor is not receiving compensation (other than from INO.com) for their opinion.
Dear Mr. Moore,
Thank you very much for a warm feedback.
It’s my pleasure to share as much as I could see in the chart.
Good luck, Aibek!
Good analysis. With a good range of choices to guess about!!
Stephen