Before we get down to the update, I would like to answer the comment of our esteemed readers posted last week in more detail about the Cup & Handle pattern on the big gold chart. I think it will be interesting for all to see the visualization of my answer. Besides that, I prepared a bonus chart for you with an established pattern and a trade setup.
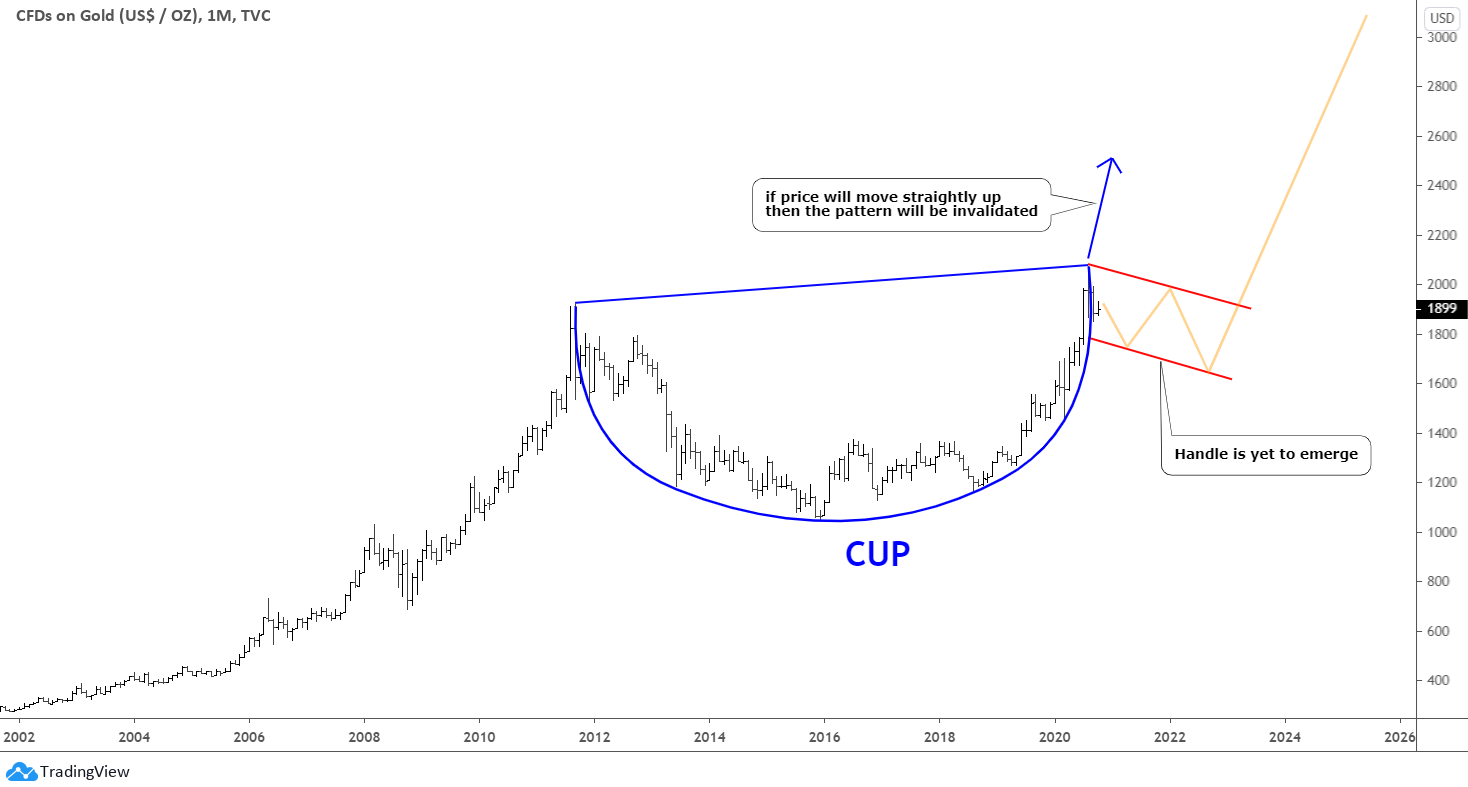
Let us start with that big gold chart first.
The reader kindly provided exact coordinates, so I just built the pattern. As we can see in the chart above, it is safe to say that the shape of a Cup could have been completed already (blue). However, as I answered to that comment, we are missing the Handle part of the pattern yet. I put the possible shape of it in red on the chart. The price should make a zigzag inside of the Handle first; it could take several years as Cup has been shaped within long 9 years. Only then, the price could continue to the upside. The target will be located beyond $3000. To sum up, the pattern itself is possible, but it is not fully shaped yet, and we should wait to see how the market will play.
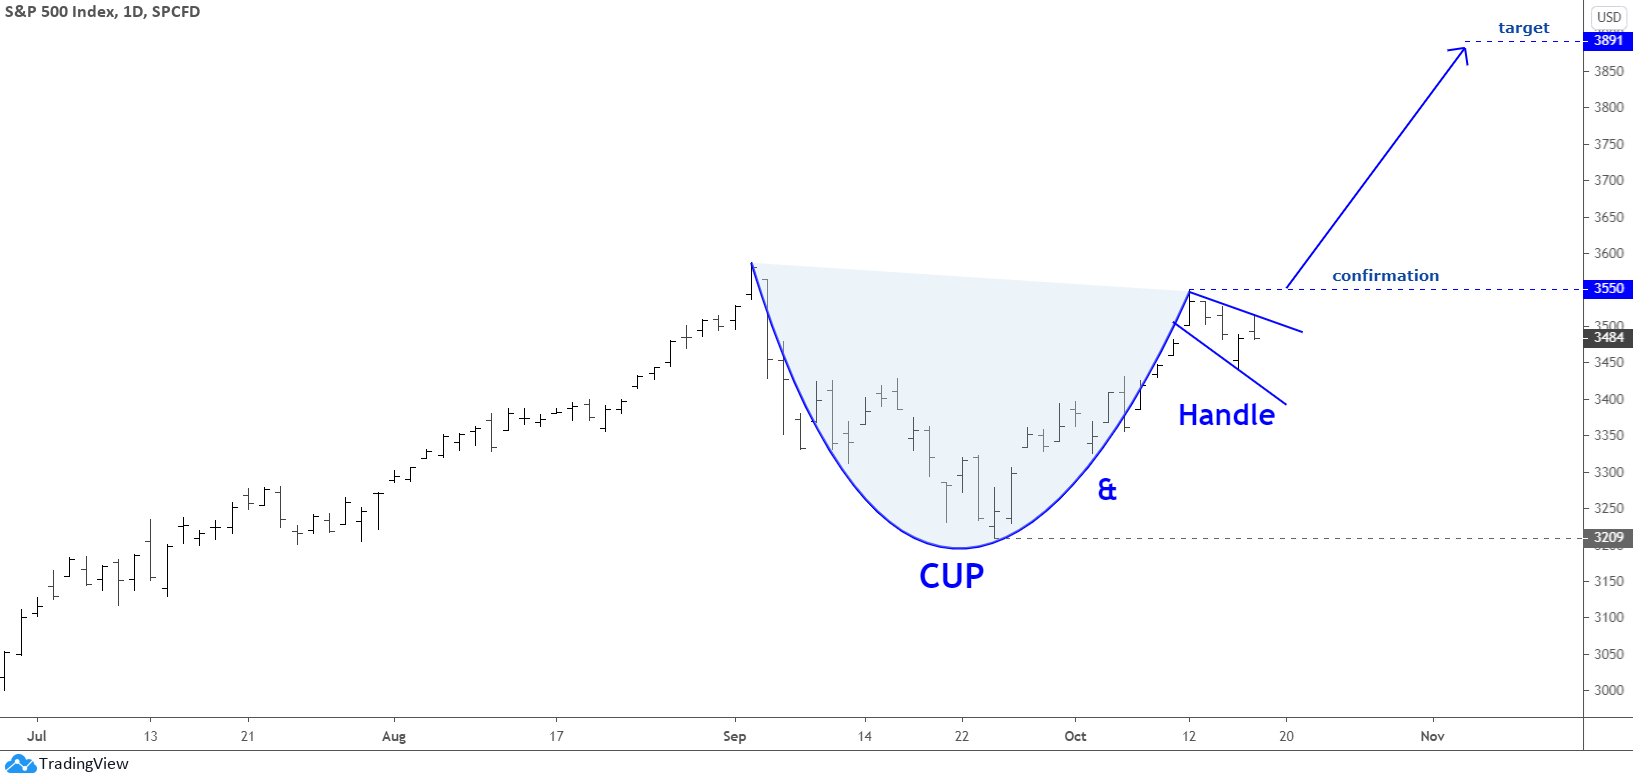
It was a lucky coincidence as I found the almost completed pattern to show you for education and even for trade action. I watched different instruments lately and detected the Cup & Handle pattern on the S&P 500 index daily chart. Enjoy it below!
This pattern on the daily chart of the S&P 500 is beautiful, and the opportunity that it gives is amazing. We have all parts of that famous pattern shaped, and the price is making a zigzag in the Handle. That's what we are missing on the monthly gold chart. The model is bullish, and when we get the confirmation on the breakup of the right side of the Cup, the move up should carry on. The target is quite ambitious, as it is located at $3891. I added the depth of the Cup ($341) to the breakout point ($3550) to calculate the aim. One could book almost 10% on this trade setup.
You could now compare the assumed pattern on the first gold monthly chart with the established model on the S&P 500 daily chart. The difference is noticeable.
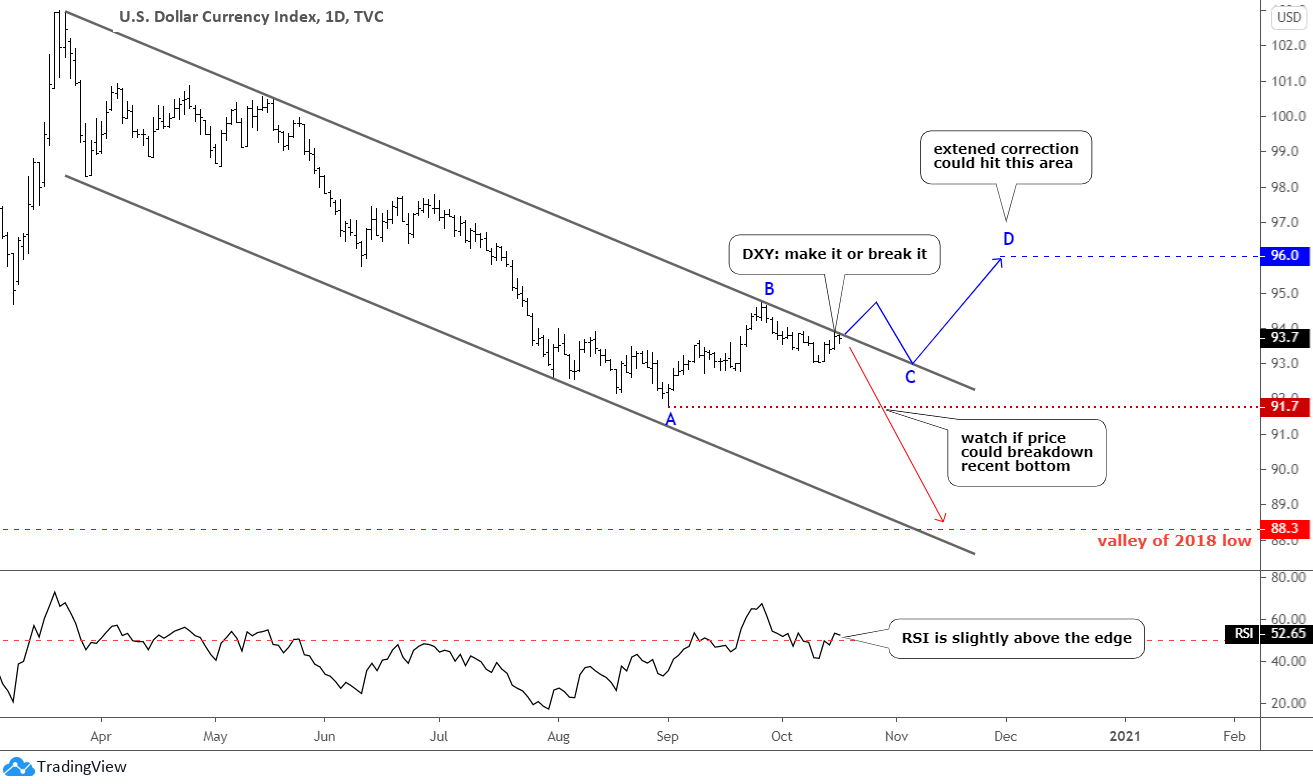
Let us get back to regular updates. The U.S. dollar index (DXY), aka the "King," will be the first.
The DXY did not touch the trendline resistance last time, but it has done it this time as it reached the edge now. If it keeps being stubborn, then the breakout is imminent. I added this option with the blue zigzag of the forecasted complex correction. A pullback could follow the breakout to broken resistance, and it will shape a sideways consolidation (BC). Once we get the C point established, the CD segment will be adjusted as now it targets the 96 mark. This would negatively affect precious metals.
In case of a reversal, the plan would remain the same as before to hit the valley of Y2018 at 88.3
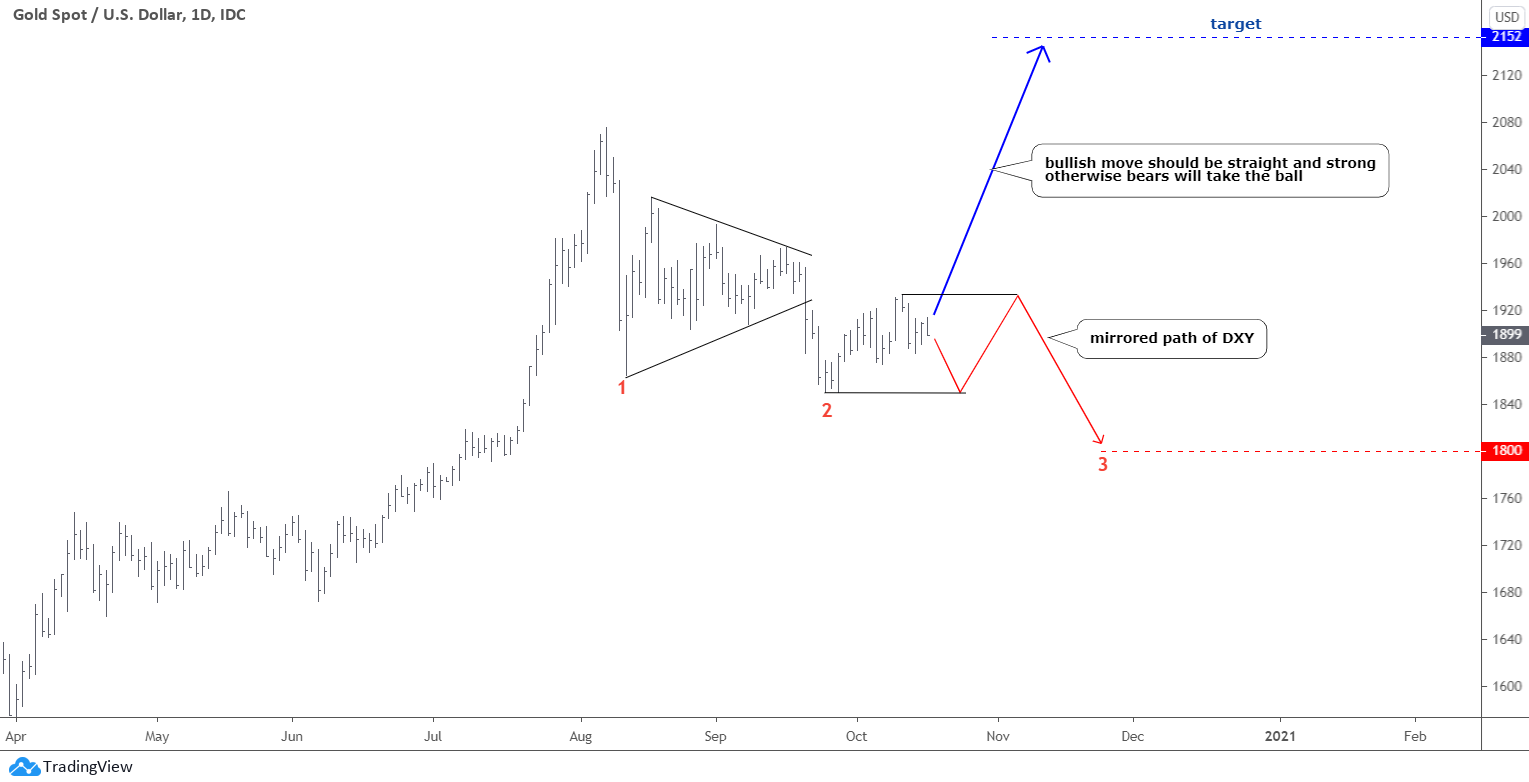
The daily gold chart follows.
"If they don't buy, I'm going to sell" this is how it works on the market. Although the stars aligned, the precious metals did not go to the upside. When the market keeps stumbling around, the risk of another leg down grows. I added that option on the chart in case the dollar breaks up. This red path down is a mirrored bullish option from the DXY chart as it shows the retest of the recent low of $1849 and further move back to the former top of $1933 to complete a sideways consolidation before the third leg down unfolds. It could hit the $1800 area at the end. The second-largest bet in the previous post was put on "a more complex correction" in precious metals; it could come true this time with a stronger dollar.
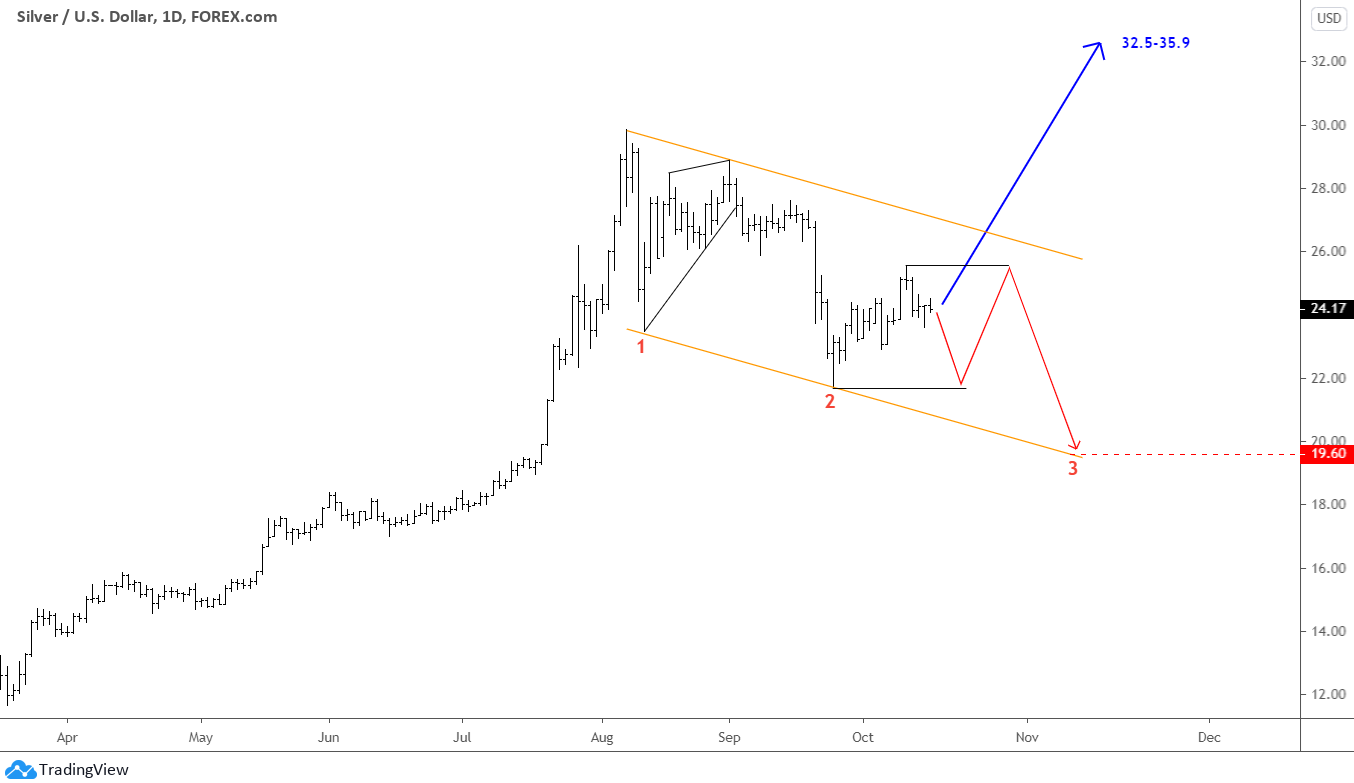
The daily silver chart is last.
The idea on the silver chart is the same as on the gold chart. I added the third leg down here as well. However, I kept the orange trend channel as it worked just perfect for limiting the second drop before. The range here is $21.67-$25.56 for the projected consolidation ahead of another drop. The touchpoint with the downside of the trend channel is in the area of $19.6. The third leg could target that point.
Check back for my update next month.
Aibek Burabayev
INO.com Contributor, Metals
Disclosure: This contributor has no positions in any stocks mentioned in this article. This article is the opinion of the contributor themselves. The above is a matter of opinion provided for general information purposes only and is not intended as investment advice. This contributor is not receiving compensation (other than from INO.com) for their opinion.

Break down to 92.75 for the DXY then rising to 95 or higher
God and Silver will have a measured move up maybe to only 1958.00 and then break down when DXY moves up.
As for the SP 500, I see the little cup and handle but think the SP 500 will break down when the DXY rises.
Dear Mr.Thompson, thank you for sharing your thoughts with all of us on the Blog. Best wishes, Aibek