Last August I posted a chart analysis of one particular commodity market index as I spotted an interesting pattern. As time goes by, we can see how my outlook emerged and after almost a year the market reached another crucial milestone or better yet a decision point.
This index is called The Thomson Reuters/CoreCommodity CRB Index (CRB). It is the gauge of the commodities market, which is comprised of 19 commodities: Aluminum, Cocoa, Coffee, Copper, Corn, Cotton, Crude Oil, Gold, Heating Oil, Lean Hogs, Live Cattle, Natural Gas, Nickel, Orange Juice, Silver, Soybeans, Sugar, Unleaded Gas, and Wheat.
So, if you watch commodities market, then the two charts below could be of strong interest to you.
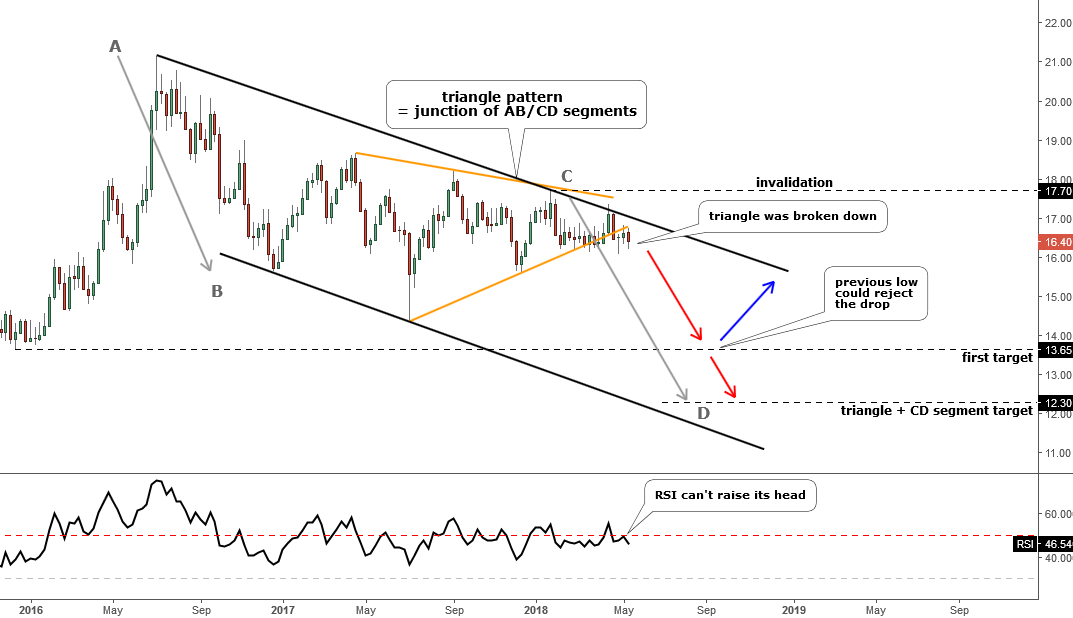
Chart 1. Thomson Reuters/Jefferies CRB Index Monthly: Failed At Resistance
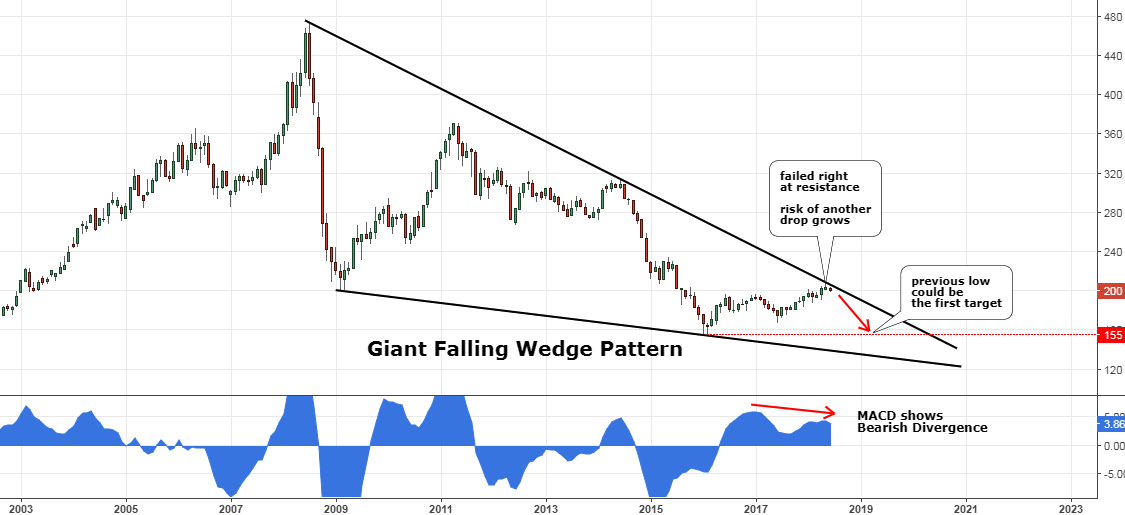
Chart courtesy of tradingview.com
Above is an update of the earlier chart. The risk/reward that time ($182) favored a long position as the upside target at the major top ($474) promised to cover risk extensively amid oversold market conditions. Continue reading "Commodities: Sell In May And Go Away?"