Back in March in my major gold update I warned you that what was being billed as a New Bull Run could easily turn out to be a complex correction. In that post’s chart, I didn’t put the small Fibonacci retracement level at 38.2% as I was impressed with the strong move to the upside from the bottom and I thought it would be useless. These days the situation has changed and I put an updated chart below.
Chart 1. Gold Monthly: First Serious Resistance
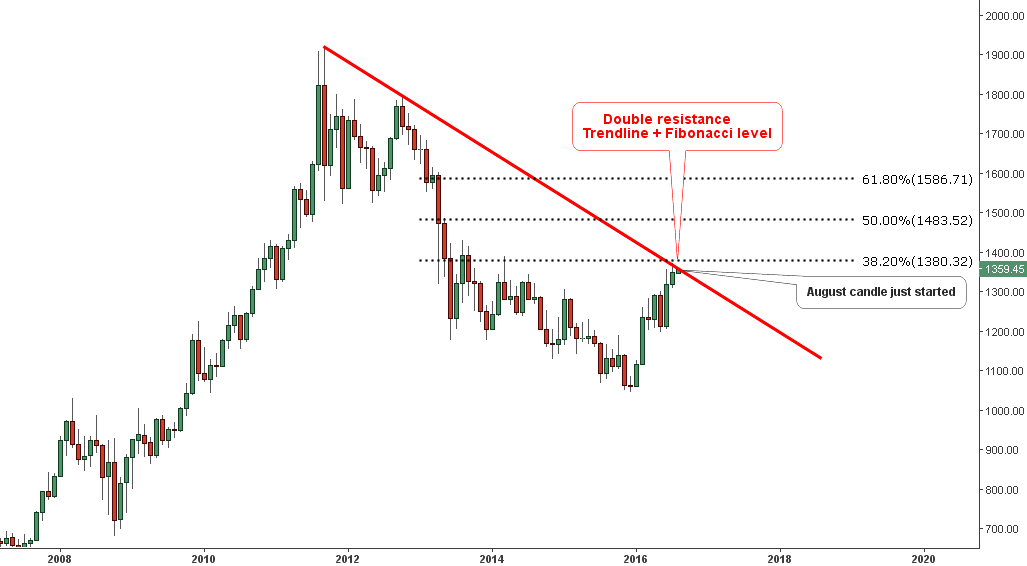
Chart courtesy of tradingview.com
Last month the gold stalled at the red trendline resistance as the price closed 25 dollars below the month’s maximum. This month the price action will be crucial as there is no room to step back. It would be hard work to crack double resistance within the $1360-1381 range, which consists of the red trendline and the 38.2% Fibonacci retracement level. Continue reading "Gold Is At The Crossroads! Which Stock Is The Most Vulnerable?"