Gold And Top Gold Stocks: Not All "Birds" Flew To The North

Aibek Burabayev - INO.com Contributor - Metals


In this post, I would like to share with you the comparative dynamics of gold and top gold stocks starting from the date when the recent local bottom of gold was set at $1241 on the 7th of October, 2016 to see how top gold stocks reacted to the recent gold reversal.

Chart 1. Gold And Top Gold Stocks: Not All “Birds” Flew To The North

Gold vs. Gold Stocks
Chart courtesy of tradingview.com

I put the chart the gold together with the 5 top gold mining stocks by market cap, which I started to cover this August. These are (ranked by market cap): Continue reading "Gold And Top Gold Stocks: Not All "Birds" Flew To The North"

Gold Is At The Crossroads! Which Stock Is The Most Vulnerable?

Aibek Burabayev - INO.com Contributor - Metals


Back in March in my major gold update I warned you that what was being billed as a New Bull Run could easily turn out to be a complex correction. In that post’s chart, I didn’t put the small Fibonacci retracement level at 38.2% as I was impressed with the strong move to the upside from the bottom and I thought it would be useless. These days the situation has changed and I put an updated chart below.

Chart 1. Gold Monthly: First Serious Resistance

Gold Monthly Chart W/Fibonacci
Chart courtesy of tradingview.com

Last month the gold stalled at the red trendline resistance as the price closed 25 dollars below the month’s maximum. This month the price action will be crucial as there is no room to step back. It would be hard work to crack double resistance within the $1360-1381 range, which consists of the red trendline and the 38.2% Fibonacci retracement level. Continue reading "Gold Is At The Crossroads! Which Stock Is The Most Vulnerable?"

Goldcorp Is Back and Spending: Could West Red Lake Gold Mines Be Next?

Goldcorp is fresh off an announced transaction of $520M for Kaminak Gold, which is a big win for the industry. The company has been quietly putting dollars in juniors, like $16M in Gold Standard Ventures, and there could be more to come. In this article, Resource Maven Gwen Preston discusses possible target West Red Lake Gold Mines and how this company is shaping up to take advantage of the initial turnaround in the market.

A million ounces of high-grade gold in Ontario, open for expansion. A management team that has done it before. A major miner as joint venture partner. A potential new discovery near the kind of structural intersection that can carry considerable gold in this part of the world. And cash in the bank to go back and drill test it. West Red Lake Gold Mines Inc. (RLG:CSNX/ West Red Lake Gold Mines Inc. (NASDAQ:HYLKF) has the right property, people, structure and plan to potentially hit a home run in a gold market looking for high grades in good jurisdictions.

RLG is headed up by Thomas Meredith. Merediths last company was VG Gold. He took the helm there when it was a broken company with a $3 million market capitalization. He cleaned up the management and board, and then focused on advancing and derisking the companys four projects, which were all historic mines in the Timmins gold camp in Ontario.

Under his leadership VG grew its resource base from 60,000 oz to 2 million oz, completed two PEAs, worked one project through a joint venture with Goldcorp Inc. (G:TSX/GG:NYSE), got permitting underway, and attracted Rob McEwen in as an investor, who took a 40% stake in VG through his company Lexam Exploration. About 18 months later Lexam and VG merged. By then, VG Gold had a market cap of $200 million.

Now Meredith is working to do it again. Continue reading "Goldcorp Is Back and Spending: Could West Red Lake Gold Mines Be Next?"

All Aboard The Gold Train

Yesterday, the Trade Triangles issued a green weekly Trade Triangle for gold. Gold (FOREX:XAUUSDO) now has three green Trade Triangles indicating that it's ready for the next upward leg in this long-term bull market.

As I have pointed out before, this quarter is the highest-rated quarter with an 83% success rate for gold trades using the Trade Triangles. Let me just be clear that this does not mean that this particular trade is guaranteed to be successful, but the odds are heavily in your favor.

I've added two charts below, a daily chart and a quarterly chart to illustrate the last time gold was in a prolonged bull market. That bull market started in Q1 of 2009 and continued for 11 quarters ending in April 2011. On the quarterly chart, you will see that every quarter for those 11 quarters the market closed higher than the previous quarter. If that same scenario plays out again, gold has 9 quarters to go.

Quarterly Chart of Gold (FOREX:XAUUSDO)

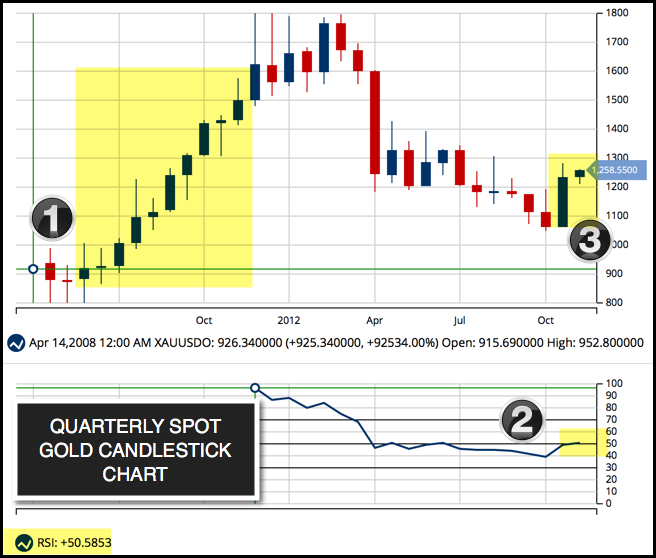
Key To Quarterly Chart

1) The start of the 11-quarter bull market
2) The RSI indicator moves to its highest levels in 3 years
3) Gold is 2 quarters into a long-term bull market

While the quarterly chart gives us a view of the big picture of how gold has acted in the past, the daily chart shows you how to use the Trade Triangles. For intermediate-term trading, you use the weekly Trade Triangle, which we just had a signal with yesterday, as the trend indicator and the daily Trade Triangle for exit and entry signals. If you are a long-term trader, then you want to rely on the monthly Trade Triangle, which has been positive for quite some time. Continue reading "All Aboard The Gold Train"

Marin Katusa: Follow the Good Guys in Mining

The most valuable resource in a mining company is often the people. Good management can attract the right investors and add value regardless of the market. In this interview with The Gold Report, Marin Katusa, founder of Katusa Research, shares his litmus test for which mining companies are worth his hard-won dollars and which ones he is avoiding for the foreseeable future.

Gold vs. US Dollar YTD Chart

The Gold Report: You seem much more positive about gold right now than when we talked in June. Based on the chart you have on Katusa Research of the U.S. dollar versus gold and in the wake of the Federal Reserve's inaction at its last meeting, what's your thesis for gold for the rest of 2015?

Marin Katusa: As I said in the spring, I don't see the Fed raising rates this year. Using some simple game theory, for the Fed not to raise rates is the best decision. I still believe that. Gold has fared well compared to the price of the U.S. dollar, better than any other hard commodity. Gold is holding its own. The reality is, because the commodity markets are down, very little capital is being invested to replace the production of gold.

In the long run, I'm very bullish on gold. It's something I'm paying very close attention to through my fund. We've started writing checks on assets that I believe are very cheap and well priced in today's currency commodity markets and that I believe a major will want in its portfolio in a few years. Gold is the currency of kings and silver is the currency of gentlemen; it always has been, and always will be. When you see living legends such as Stanley Druckenmiller and well-known successful fund managers plowing hundreds of millions of dollars into gold, it's obvious gold is appealing at these prices.

TGR: Will the power of gold help the majors or the juniors more? Continue reading "Marin Katusa: Follow the Good Guys in Mining"