Stocks Lose Early Gains As Tech Declines

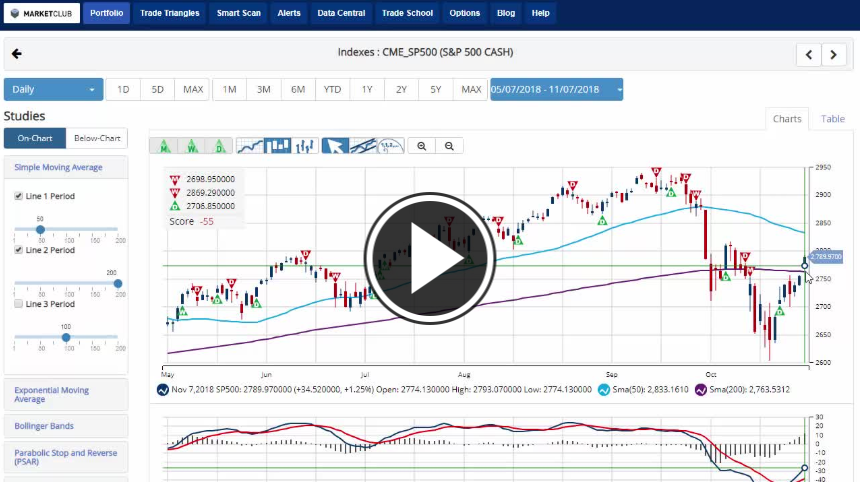
Hello traders everywhere. What looked to be a promising humpday this morning quickly turned negative as the DOW reversed course. It had been trading over 200 pts higher in early trading but has since fallen over 330 pts trading below 25,000 and losing over 1.3% on the day. The S&P 500 and NASDAQ have followed suit with both indexes losing over 1.2%. It sure looks like volatility is here to stay.

The turn lower coincided with Apple breaking below its 200-day MA trading losing over 2.7% on the day and currently trading at the session low of $186.70 and trading 20% below its 52-week high, entering a bear market. The decline comes after Guggenheim downgraded the stock. This downgrade comes as UBS cut its 12-month price target on the stock and follows a target reduction at Goldman Sachs. Investors have been worried the company's iPhone sales will slow down soon.

trading

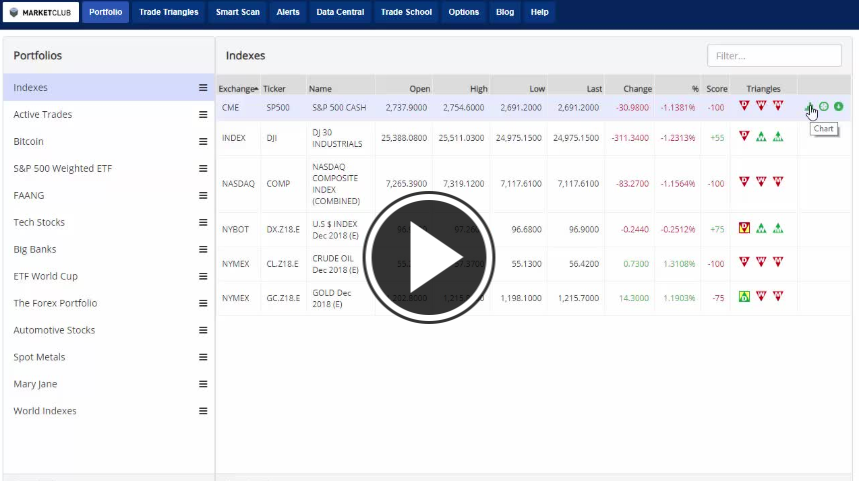
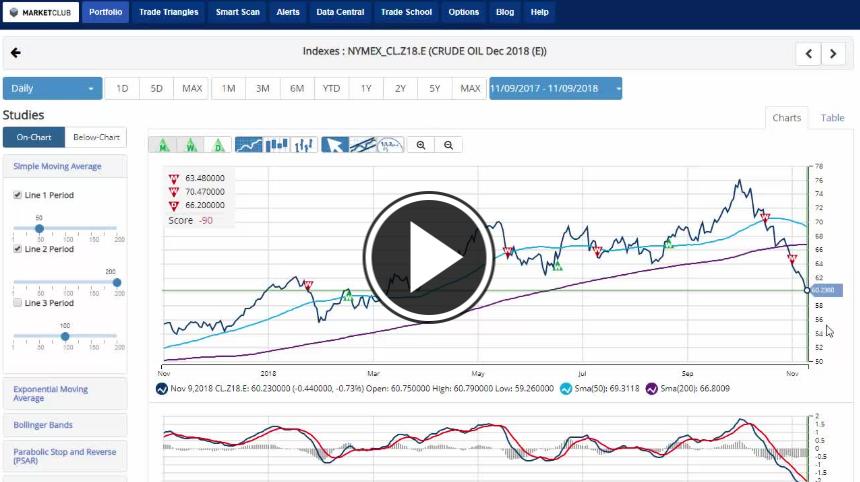
The only bright spot in the market is crude oil, which is looking to stop its twelve-day slide trading higher on the day. Oil is up over 1% trading at $56 a barrel, off the session low of $55.13. OPEC and Russia signaled Sunday they could decide at their December 6th meeting to hold back output by around 1 million barrels a day. This announcement came amid signs the market will be oversupplied in 2019.

The International Energy Agency warned in its report Wednesday that global oil supply was on pace to significantly outstrip demand, as Russia, Saudi Arabia, and the U.S. are pumping out crude at record levels.

President Donald Trump sent another warning to producer cartel OPEC (Organization of Petroleum Exporting Countries) earlier this week, saying he hoped the group would not cut output in a move to buoy prices. The fall in crude has also sparked worries of a global economic slowdown.

Key Levels To Watch This Week:

Continue reading "Stocks Lose Early Gains As Tech Declines"

Cyclical Commodities Continue To Weaken

Crude Oil and Industrial Metals continue downward. This is significant per this NFTRH monthly chart showing these items and the broad CRB itself having hit trend lines from the 2008 highs. These pullbacks from long-term trend lines are notable and qualify cyclical commodities as risk indicators for the cyclical macro.

industrial metals

Here is oil’s weekly view. Key support was lost last week as noted in this article: Positive Implications for Gold Miners if Crude Oil Breaks Down. I expect currently oversold WTI to rally from the noted support area, but remain ‘not bullish’ on this cyclical commodity (and remain in scouting mode for the upcoming gold miner buying opportunity). Continue reading "Cyclical Commodities Continue To Weaken"

Weekly Futures Recap With Mike Seery

We've asked Michael Seery of SEERYFUTURES.COM to give our INO readers a weekly recap of the Futures market. He has been Senior Analyst for close to 15 years and has extensive knowledge of all of the commodity and option markets.

Michael frequently appears on multiple business networks including Bloomberg news, Fox Business, CNBC Worldwide, CNN Business, and Bloomberg TV. He is also a guest on First Business, which is a national and internationally syndicated business show.

Gold Futures

Gold futures in the December contract settled last Friday in New York at 1,233 an ounce while currently trading at 1,211 down over $20 for the trading week as the precious metals across the board look to move lower in my opinion. Gold prices are trading below their 20 and 100-day moving average as the trend has turned negative because the U.S. dollar is right near another contract high as interest rates in the United States are on the rise and should continue to climb into 2019. If you are bearish, I would place the stop loss at 1,239 as an exit strategy as it looks to me that prices will retest the 1,195 level possibly in next week's trade as the commodities across the board look very week as now everything is following crude oil to the downside. Silver prices are down over $0.25 today as it looks like that will retest their contract low of 13.96 possibly in next weeks trade as that is also putting pressure on gold as the only bullish commodity is the S&P 500 which reacted very positively to the midterm elections. Volatility in gold is starting to increase and remember if you're trading a smaller account you can trade the mini contract which is 1/3 of the size of the large contract, therefore, reducing the monetary risk.
TREND: LOWER
CHART STRUCTURE: SOLID
VOLATILITY: AVERAGE

Continue reading "Weekly Futures Recap With Mike Seery"

Crude Oil Drags Down The Stock Market

Hello traders everywhere. Overall the stock market was looking to finish out a strong week on a high note, but it was not be. Crude oil had other ideas and decided to spoil the party by doing something that it hasn't done since 1984, that's right, I said 1984. For the first time since 1984 oil will post ten straight losing sessions while suffering a drop of over 20% from the recent high and trading below $60 for the first time since March of this year.

Oil's move lower put a bit of a damper on the week for stocks, but overall the big three indexes will still spot weekly gains with the DOW leading the way with a gain of about +2.5% as I write. The S&P 500 checks in with a weekly gain of +1.6% and NASDAQ will still post an increase of +.30% as we head into the close.

Crude Oil

We also woke up to a surprise from gold, a new red weekly Triangle indicating that the intermediate-term trend has resumed its downward move changing the Chart Analysis Score to -100 and pushing gold down with a weekly loss -1.9% trading close to $1,200.00. On the flip slide, the U.S. dollar is still chugging along posting a weekly gain of +.43%. Meanwhile, Bitcoin continues to go nowhere and will post a weak increase of +.10% on for the week.

Key Levels To Watch Next Week:

Continue reading "Crude Oil Drags Down The Stock Market"

Stocks Rise After Midterm Elections

Hello traders everywhere. The midterm elections are over, and the stock market is on the move higher. Are we going to get a long-term post-election rally or is this just a short-term bump? The S&P 500 has jumped above its 200-day MA for the first time in eleven days, but we're still waiting on a new green weekly Trade Triangle to exit a short position in the S&P 500.

The DOW broke above its 50-day MA and issued a new green weekly Trade Triangle at 25,817.68 pushing the Chart Analysis Score to +75 indicating that a long position may be in order for the DOW. We'll have to see if there's carry through at the end of the week or if this is just a short-term election euphoria bump.

The NASDAQ is trading just below its 200-day MA standing at 7,519.45 with a Chart Analysis Score of -70. Even if The NASDAQ trades above the 200-day in the coming days it still has some work to do to enter a sidelines position.

Midterm Elections

On the opposite end of the spectrum, the U.S. dollar is not buying into the post-election hype and traded as low as 95.48 before backing off the session lows. But it is still down on the day and is down .60% on the week. Continue reading "Stocks Rise After Midterm Elections"