Silver/Gold Ratios Is A Guide As Inflation Signals Fade Again

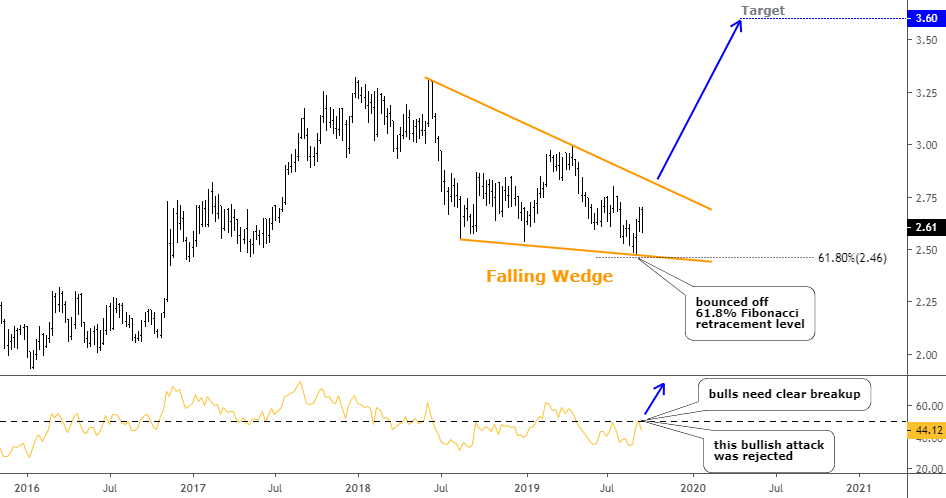
The interplay between gold and silver is a critical component to understanding what is out ahead; to understanding whether long-term Treasury yields will rise and if they rise, whether it will be due to inflationary pressures. It is a critical component to understanding whether cyclical commodities and other aspects of a greater inflation/reflation trade will finally break existing downtrends. See…

The Continuum is Still in the Deflation Camp (9.24.19)

Pictures of a Reflationary Bounce-a-Thon (9.11.19)

The first and more recent post noted that the 30yr yield needs to climb above 2.2% to even think of hinting toward a temporary inflation trade. The chart from that post shows that while the Continuum is of a long, deflationary structure the periodic pings upward to the (monthly EMA 100) limiter often represent times of cyclical inflationary bursts. This morning the 30-year yield stands at 2.15%.

long-term treasury yields

As for the older post linked above, it was personally a little difficult not to buy in (other than for a couple of ‘bounce’ trades) to the prospect of the global inflation that Central Banks are trying to summon. But that post and others have routinely shown intact downtrends in the inflatables. So it was a case of ‘break the trends and we’ll talk inflation trade’. Here are the daily charts of the CRB index and a key headline commodity. Continue reading "Silver/Gold Ratios Is A Guide As Inflation Signals Fade Again"

What Should Traders Expect From Impeachment Proceedings?

News of the formal impeachment proceedings came just after the markets closed on September 24, 2019. The markets had already broken a bit lower most of the day after Consumer Confidence and Jobs expectations were weaker than expected. We had just authored a public research post about our belief that the Technology sector was about to breakdown and begin to move lower. Additionally, we pushed out a post about how Silver would become the “Super-Hero” of 2019/2020 based on our expectations of further gains.

We believe the new impeachment proceedings will result in a market that is very similar to what happened when the US invaded Kuwait in August 1990. At that time, the US launched a very fast invasion of Kuwait that prompted a massive news event and resulted in hours of new invasion video that drew millions of Americans into watching the news every night. This invasion was almost like an extended Super Bowl or an extended World Series event where millions of people are actively engaged in this event, stop engaging in the local economy and focus their attentions on the news cycle, content and political circus originating in DC. But first, be sure to opt-in to our free-market trend signals newsletter

What Does This Mean For Traders

For traders, it means we have to be prepared for just about anything. It means the news events will become even bigger drivers of market rotation and trends as well as the fact that we must prepare for weaker economic data over the next 13+ months. The impeachment process is going to be a dramatic distraction for many people and business ventures. Many will simply fall into a “protectionist” mode where new expenses, expansion and other facets of life/business will be put on hold until after November 2020 (or later).

Our research team believes the initiation of these impeachment proceedings will act as a process of muting or weakening the US economy over time. Starting out slowly at first, then gaining strength as the news cycle picks up more and more “dirt” while both sides posture and position for advantage into the November 2020 election cycle. The end result will be a decidedly weaker US economy as a result of this new impeachment process and we believe the final outcome could leave some career politicians bloodied and battle-weary. Continue reading "What Should Traders Expect From Impeachment Proceedings?"

Options: You Choose Whether You Win 70%, 80% or 90% Of Your Trades

Previously, I wrote an article putting forth the efficient market hypothesis termed “There's No Edge In Stock Picking” and how less than 10% of fund managers outperform their benchmark over the long-term. These bleak performance metrics and the fact that there’s only a 36% chance that you pick a stock that outperforms the index is what makes options trading so effective.

Whether you want to win 70%, 80% or even 90% or your trades, you dictate your probability of success when it comes to options trading over the long-term. If you set your probability of success at ~85% and make trades at that probability level through all market conditions over the long-term on the scale of hundreds of trades, you’ll end up winning ~85% of your option trades. Options trading allows one to profit without predicting which way the stock will move. Options aren’t about whether or not the stock will move up or down; it’s about the probability of the stock not moving up or down more than a specified amount. Put simply; options are a bet on where stocks won’t go, not where they will go.

Options trading can generate consistent income and mitigate portfolio risk while producing high probability win rates. Options allow your portfolio to generate smooth and consistent income month after month without predicting which way the stock market will move. Running an option-based portfolio offers a superior risk profile relative to a stock-based portfolio while providing a statistical edge to optimize favorable trade outcomes. Options are a long-term game that requires discipline, patience, time, maximizing the number of trade occurrences and continuing to trade through all market conditions. An options-based approach provides a margin of safety with a decreased risk profile while providing high-probability win rates that are determined by the trader himself.

Empirically, over the previous 12 months, I’ve produced a return of 8.6% relative the S&P return of 3.2% while winning 85% of my trades via leveraging ~70 different ticker symbols. Continue reading "Options: You Choose Whether You Win 70%, 80% or 90% Of Your Trades"

Copper Update: Compressed Spring Could Snap Back Hard

I’ve had a bearish outlook for copper for the past 2 years, starting with my post back in September 2017 when I had doubted the metal’s ability to sustain a long-term rally. Last July, we got the final confirmation of the trend reversal to the downside. And this past February I shared with you a promising trading opportunity, which had appeared in the copper market as the short-term upward correction invited the bears to sell the copper again around $3.

Indeed, copper has plummeted since then reaching the $2.48 low at the start of this month, but the following rapid bounce into the $2.70 area signaled a possible reversal ahead.

Let’s check the charts below to see if we can find some clues behind this worrisome price action.

I start with the weekly chart as I spotted a bullish pattern there already.

Weekly Cooper Chart
Chart courtesy of tradingview.com

As I said above the price printed the low of $2.48 and quickly reversed then. I added the Fibonacci retracement level of 61.8% to the chart, and you can see now that the price bounced right off it. In my February post, I applied AB/CD segments to set the target area for an anticipated drop and even used the extension ratio, where the CD is even larger than the AB segment. Continue reading "Copper Update: Compressed Spring Could Snap Back Hard"

Weekly Futures Recap With Mike Seery

Palladium Futures

Palladium futures in the December contract is currently trading at 1,629 after settling last Friday at 1,600 continuing its bullish momentum hitting an all-time high once again as strong demand continues to fuel prices higher.

I was looking at a bullish position a couple of days back but was not executed as I am currently sitting on the sidelines, however, if you are long a futures contract I would stay long as I think higher prices are ahead and if you've been following any of my previous blogs you understand I think prices could hit the 2,000 level. Palladium is trading far above its 20 and 100-day moving average as this is the strongest precious metal as I do not have any recommendations out of this sector at the current time.

If you are long a futures contract I would continue to place the stop loss under the 10-day low standing at 1,518 as an exit strategy, however, the chart structure will improve next weeks trade therefore the monetary risk will be lowered as I see no reason to be short as that would be counter-trend trading which is very dangerous over the course of time.

TREND: HIGHER
CHART STRUCTURE: POOR
VOLATILITY: HIGH

Continue reading "Weekly Futures Recap With Mike Seery"