U.S. Crude Production Soars In August

The Energy Information Administration reported that August crude oil production averaged 11.346 million barrels per day (mmbd), up 416,000 b/d from July. The surge was led by a 126,000 b/d increase in Texas and a 74,000 b/d rise in the Gulf of Mexico. In addition, the increases were broadly based, implying a lagged-response to rising oil prices this year has created enough incentive to ignite production. The large rise in Texas was also unexpected due to reported pipeline constraints.

production

production
Continue reading "U.S. Crude Production Soars In August"

Amazon's October Drop Hurting ETFs

Most recent data shows 246 different Exchange Traded Fund’s owned more than 24.7 million shares of Amazon.com (AMZN). But, the companies recent 20.9% decline in the month of October alone, (Amazon opened October trading at $2,021 per share and closed the month trading at $1,598 per share, or a 20.9% decline) has certainly had an effect on not only those 246 different ETFs and their investors, but also those investors whom may have directly purchased shares of the company. Furthermore, due to its market capitalization, it was a very heavily weighted stock in some large ETFs, which makes its recent decline even more painful.

Some of the hardest hit ETFs over the last month was the SPDR S&P 500 ETF Trust (SPY) because Amazon was its second, now third, largest holding and SPY was the single largest owner of Amazon stock. ProShares Online Retail ETF (ONLN) had 22% of its assets in Amazon as of late, while the Vanguard Consumer Discretionary ETF (VCR) and the Consumer Discretionary Select Sector SPDR Fund (XLY) both had more than 20% of their assets in Amazon.

Throughout the ETF world, there where eight different ETFs which had more than 10% of their assets in Amazon in recent weeks. Most were in the consumer discretionary sector, but a few internet focused ETFs such as the Invesco QQQ ETF (QQQ), and the First Trust Dow Jones Internet Index ETF (FDN) had more than 9% of their assets in Amazon. Continue reading "Amazon's October Drop Hurting ETFs"

Facebook - Compelling Buy Heading Into Q3 Earnings

Facebook’s (FB) disastrous second quarter conference call erased $119 billion in market capitalization in a single session marking the worst one day drop for any large-cap company in history while the stock shed a fifth of its value. Since then, ancillary fallout emanating from its core data misuse scandal involving Cambridge Analytica continue to surface.

Security issues affecting 50 million accounts, a lawsuit alleging concealing video ad measurements and increasing EU scrutiny have continued to plague the stock since its second-quarter implosion. The original mishandling user data resulted in the stock tumbling from $195 to $152 or 22% at the time. Facebook appreciated off those data misuse lows and broke out to $220, however, this scenario ended abruptly on the heels of its Q2 earnings. Facebook issued a major guide down in growth for the next few quarters tampering growth expectations in the near term. Facebook is facing a challenging confluence of slowing revenue growth, margin compression and stagnant daily active users in the near to intermediate term.

There’s been a recent initiative that has the backing of four large institutional investors to remove Mark Zuckerberg as Facebook’s chairman in the wake of all of these security issues. Despite these headwinds, Facebook is still posting accelerating revenue growth across all geographies, expanding market penetration with Instagram’s IGTV, Facebook’s Stories and monetization efforts in Messenger and WhatsApp. Facebook is still poised to grow at a double-digit clip with the most recent growth rate coming in at 42% in Q2.

The long-term picture looks bright for Facebook, and the recent sell-off in the stock and tech cohort is a good opportunity to initiate a long position as the company contends with and addresses all the issues across its platforms (Figure 1). Facebook remains a premier large-cap growth stock and inexpensive relative to other large-cap growth stocks in its cohort heading into Q3 earnings.

Facebook
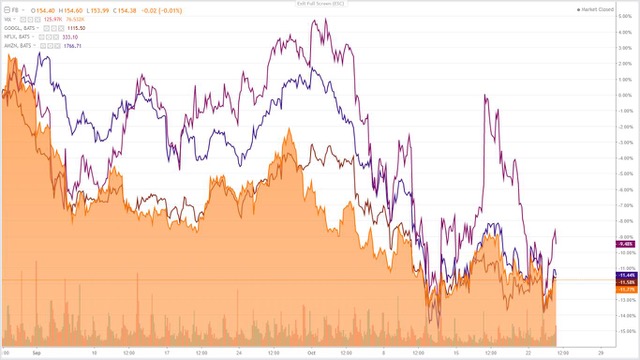
Figure 1 – FANG cohort performance throughout the tech sell-off with Facebook, Amazon, Netflix, and Google all shedding ~10% of their market capitalization

Scandals and High-Level Departures

There’s been a slew of negative press regarding additional issues negatively impacting the company’s platform and inflicting further damage on its reputation. Facebook disclosed a security issue that affected 50 million accounts. Continue reading "Facebook - Compelling Buy Heading Into Q3 Earnings"

Are We Better Off Today Than Two Years Ago?

Two weeks from now Americans will head to the polls to vote in what has been billed as “the most important election of our lifetime.” That may be a bit of hyperbole, but it will no doubt be one of the most important – maybe not as important as the previous one in 2016, but certainly a close second.

Since then, there have been some huge changes in the financial markets and the economy, nearly all of them wildly – and demonstrably – positive. CNBC was nice enough to quantify them the other day in this chart, and the numbers are startling.

I’ll just mention a few:

  • S&P 500: Up 32% since the 2016 election.
  • Average hourly earnings: Up 5%, to $27.24 from $25.88.
  • Nonfarm payrolls: up 4.4 million, to 149.5 million from 145.1 million.
  • Unemployment rate: 3.7%, down from 4.9%.
  • Consumer confidence: up 37 points, to 138 from 101.
  • Corporate tax rate: 21%, down from 35%.
  • Assets held by the Federal Reserve: down 6%, to $4.22 trillion from $4.52 trillion.

Needless to say, there have been some negatives: Continue reading "Are We Better Off Today Than Two Years Ago?"

Natural Gas ETFs Took A Wild Swing In September

In September, the price of natural gas fluctuated more than we had seen since February of this year and it's likely that while some investors made vast sums of money, others lost just as much, if not more. But what made September so crazy was that natural gas made a significant reversal right in the middle of the month.

The price of the United State Natural Gas ETF (UNG) ended the month of August at $23.95 and closed at $24.83 on the last trading day of September. That move represents a 3.6% increase, not an insignificant amount but also not making anyone piles of money. But, while the price of natural gas started the month at $23.95, its lowest closing price for the month came on September 14, where it bottomed out at $22.69. Had you been watching the price, recognized this was the bottom and bought on September 14 or 15, you could have made yourself a nice 9.4% gain (the gain would be higher if you continued to hold for a few days at the beginning of October).

Again though, a 9% gain is a good return, but not necessarily what I would call “rolling in the dough.”

In order to make that kind of money, you would have had to use leverage. If you had purchased shares of the VelocityShares 3X Long Natural Gas ETN (UGAZ) at the close of September 14 and sold them at the close on September 28, you would have made a sweet profit of 30%. (Again, this would have been even larger, upwards of 50% if you held onto your UGAZ the first few days of October.)

Why did UGAZ perform so much better than UNG? Well, that is because UGAZ is three times leveraged natural gas fund, meaning it gives your three times the return of natural gas if the commodity moves higher. The flip side of that is you can lose three times the amount of money if natural gas prices fall while you hold the shares. Continue reading "Natural Gas ETFs Took A Wild Swing In September"