Where do you think USDJPY will go?

The Japanese yen is the second largest component of the Dollar Index (DX). It occupies 13.6% of it.

The real interest rate differential is the main reason behind the current severe weakness of the yen. I have already visualized it for you in my earlier post in August.

The Bank of England (GBP, 3rd largest part of DX) and lately the European Central Bank (EUR, the largest component of DX) raised their interest rates significantly during the last meetings. The Bank of Japan (BOJ), the Japanese Central Bank has kept its negative rate of -0.1% since 2016. Moreover, it repeated that it would not hesitate to take extra easing measures if needed, falling out of a global wave of central banks tightening policy.

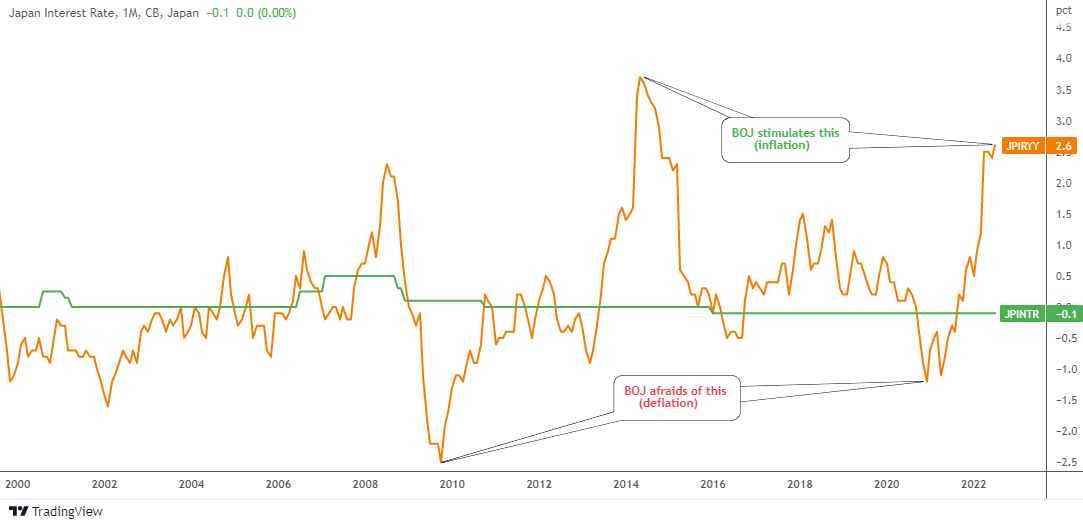
Why BOJ is so dovish? There are several reasons. One of them, the history of inflation as shown in the chart below.

JPN Interest Rate VS Inflation

Source: TradingView

Japan has had a chronic deflation since the 1990s after the asset bubble burst. We can see how short term spikes of inflation (orange line) into the positive territory were short-lived. The BOJ didn’t even touch the interest rate in spite of inflation that has soared to unseen levels of 3.7% in 2014. This time around, the inflation didn’t race to the same peak and as I wrote above, the BOJ thinks of an opposite – easing!

The BOJ governor Mr. Kuroda said in the summer “If we raise interest rates, the economy will move into a negative direction.” The Japanese Central Bank does not want to cause a recession as the economy is still fragile.

Maybe the next chart could clarify the logic of the BOJ. Continue reading "Where do you think USDJPY will go?"

ARKK Fund's Wild Ride

After its first year of trading in 2015, the ARK Innovation ETF (ARKK) increased by 87.38% in 2017!

The fund produced a gain of 3.76% in 2015 and a small loss of 1.96% in 2016, all of a sudden, the boom in 2017! 2017 was followed up by another modest gain of just 3.58% in 2018. But in 2019, ARKK made 35.73%.

Then, despite 2020 being the year we will all remember the Covid-19 pandemic beginning in the United States and the stock markets crashing when the country shut down in an attempt to slow the spread of the deadly virus, ARKK showed its investors a return of 152.52%.

Unfortunately, in 2021, the fund did not perform as well, actually posting a loss of 23.35% for the year. And while we still have a few months left in 2022, year-to-date ARKK is down 49.17%.

Even though 2021 and 2022 have not been good to ARKK, the fund is still up an annualized 16% over the last five years. That is due to the incredible performance it experienced in 2019 and 2020.

Since its inception, some would say ARKK has been somewhat volatile. That is primarily due to the fund's lead investor, Cathie Woods, and how she takes what many would consider 'very long-shot bets.' Woods often invests in unproven technologies and companies trying to develop cutting-edge technology.

Cathie Woods believes the future of technology will, if it already hasn't, truly change the world. By looking at the performance of not just her flagship fund, ARKK, her other funds all focus on the same idea; finding innovative companies. But that comes with risk.

And Cathie Woods' ARK funds have a lot of risk in them. If the companies Woods invests in don't perform well, Woods funds take big hits. But, the other side of this coin is also at play. Continue reading "ARKK Fund's Wild Ride"

2 Restaurant Stocks In Undervalued Territory

It’s been a challenging year thus far for the restaurant industry, with dollars typically allocated to entertainment and a Friday night out wrestling to steal priority from rising gas bills, elevated energy costs, and higher mortgage rates.

Some restaurants have resorted to discounting to drive traffic, while others have relied on menu innovation and limited-time offers vs. promotional activities to protect their already softening margins.

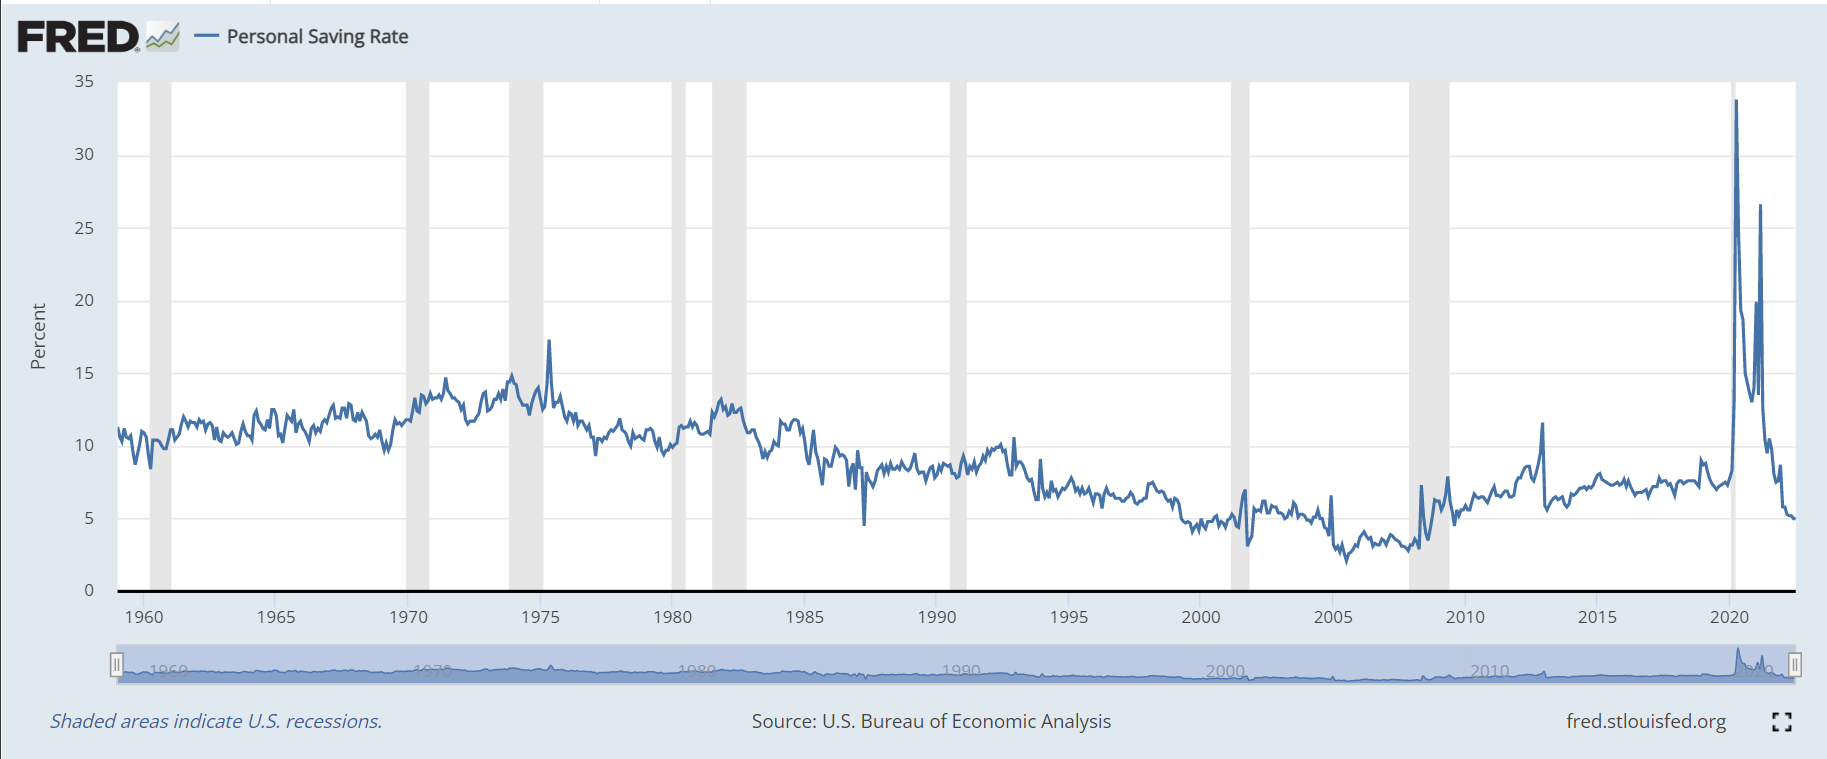
FRED Personal Saving Rate

(Source: Twitter, ND Wealth Management, Steve Deppe)

Those brands that are the most out of touch have continued to raise prices at a double-digit pace to ensure they maintain margins, with Chipotle (CMG) being one such offender. While this is likely to protect margins in the interim and allow the company to meet earnings estimates, it could backfire over the medium-term, with loyal customers feeling taken advantage of after being hit with consistent menu price increases in a recessionary environment.

Although this has made it difficult to invest in the sector, a few names are doing a great job navigating the current environment, and following recent share price weakness, they’ve slipped into undervalued territory.

One is a new breakfast chain that’s bucking the negative traffic trends in the casual dining space and enjoying industry-leading retention due to a key competitive advantage. The other is a pizza chain that’s enjoying strong unit growth, and while it’s having a tough year, annual EPS is forecasted to hit new all-time highs in FY2023 and FY2024.

Let’s take a look below: Continue reading "2 Restaurant Stocks In Undervalued Territory"

ETFs - How They Help Build Wealth

The idea of pooling investment assets has been around for centuries. Mutual Funds first appeared in the 1920s. But it wasn’t until the 1980s that mutual funds became widely popular with mainstream investors.

In recent years, ETFs have taken off as an alternative to mutual funds.

An exchange-traded fund (ETF) is a “basket” of stocks, bonds, or other financial instruments that gives convenient exposure to a diverse range of assets. ETFs are an incredibly versatile tool that can track anything from a particular index, sector, or region to an individual commodity, a specific investment strategy, currencies, interest rates, volatility, or even another fund.

You can do about anything with them — hold a diversified portfolio, hedge, focus on a particular sector, or even profit in a bear market.

The most significant practical difference between mutual funds and ETFs is that ETFs can be bought and sold like individual stocks — and mutual funds cannot. Mutual funds can only be exchanged after the market closes and their Net Asset Value (NAV) is calculated. Shares of ETFs can be traded throughout regular market hours, like shares of stock.

Both mutual funds and ETFs have expense fees that can range from low to high. Mutual funds can have front or backend loads or redemption fees in addition to management fees.

ETFs that trade like shares have commissions to buy and sell. But some ETFs are so popular that brokers offer commission-free trading in them.

So Many Choices

The sheer number and variety of ETFs can be a bit mind-boggling. Over the last 20 years, we’ve seen just a couple hundred ETF offerings grow to more than 8,000 worldwide, encompassing more than 10 trillion in assets.

A surprising number of ETFs have failed. They started with an interesting focus (well, “interesting” to somebody) but failed to attract enough interest to remain viable. For this very reason, I avoid narrow niche ETFs that trade with low volume.

I eliminate many ETFs on poor liquidity alone. I’m not interested if there’s not much volume in a product. I don’t want to suffer high slippage from wide bid/ask spreads. I want to get in and out quickly and at fair prices. Continue reading "ETFs - How They Help Build Wealth"

Gold/Silver Ratio Shows S&P 500 Is On The Edge

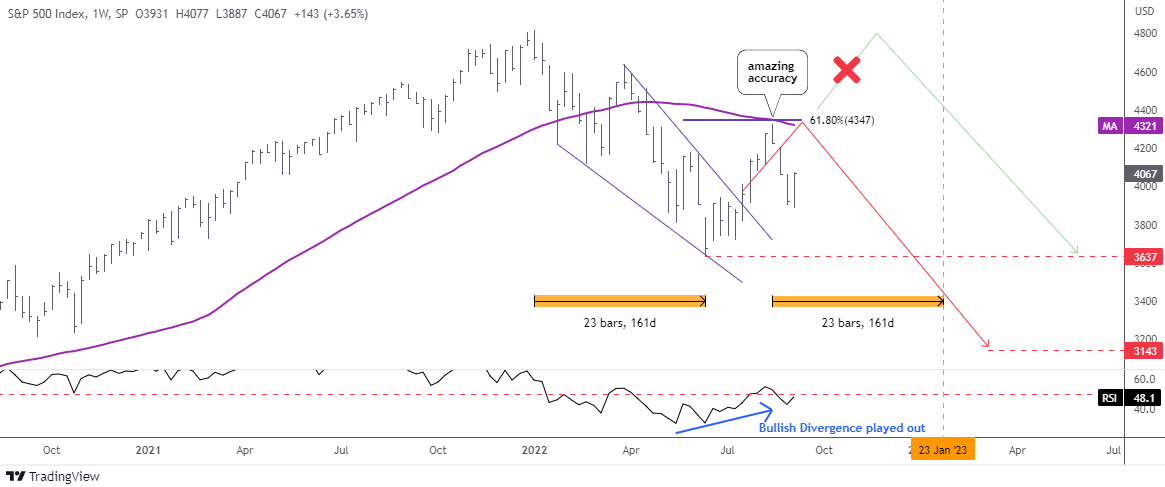
It’s time to update the S&P 500 index chart as it emerged inch-perfect since the last update in July.

SP500 Weekly Chart

Source: TradingView

To refresh your memory, I kept the main paths untouched and added new crucial highlights.

The idea of the upcoming breakout of the Falling Wedge pattern (blue converging trendlines) was posted right on time on the Blog as it played out instantly. Indeed, the Bullish Divergence of the RSI indicator with the price chart played out as planned supporting the breakup of the pattern’s resistance.

The majority of readers got it right choosing the red path as a primary scenario. The price action has been amazingly accurate in the 61.8% Fibonacci retracement area where the price failed to overcome the barrier and reversed to the downside from the minor top of $4,325 following the red zigzag.

I added the 52-week simple moving average (purple) to show you how strong the double resistance was at the $4,347-$4,349 level.

The next support is located in the valley in June at $3,637. Continue reading "Gold/Silver Ratio Shows S&P 500 Is On The Edge"