It’s Time To End "Considerable Time" Talk

George Yacik - INO.com Contributor - Fed & Interest Rates


What do you think will happen first: The Federal Reserve starts to raise interest rates, or the Cubs win the World Series for the first time since 1908?

Richard Lehmann, writing in his Fixed–Income Watch column in the recent issue of Forbes magazine, says the odds are about the same. Lehmann expects the Fed to keep short-term rates pretty much where they are – i.e. at or near zero – for some time to come. "The Fed talks a good line and promises to act responsibly once employment and the economy improve or the threat of deflation disappears," he writes. "But that's kind of like waiting for the Chicago Cubs to win the World Series again."

Actually though, the chances of the Cubs winning the World Series soon don't look so far-fetched. Now under Theo Epstein, the principal architect of the 2004 World Champion Red Sox that broke the 86-year old Curse of the Bambino, the Cubs have put together a solid team of talented young players and added former Tampa Bay Rays manager, Joe Madden, as their skipper during the off-season. Now they've also reportedly signed free agent pitcher, Jon Lester. Las Vegas currently has the Cubs at about 14 to 1 odds to win the 2015 Series, one of the top eight or so teams in baseball.

Can we say the same thing about the Fed raising rates soon?
Continue reading "It’s Time To End "Considerable Time" Talk"

Platinum And Palladium Chart Analysis

Aibek Burabayev - INO.com Contributor - Metals


Platinum Monthly Chart Analysis

Platinum fell in a downtrend in 2011 after the price formed a reversal double top pattern, which was confirmed on the RSI. Price rapidly reached $1400/oz, scoring $445 for the bears. The market easily overcame 23.6% and 38.2% Fibonacci retracement levels, but was stopped in four consecutive attempts by a very hard 50% level at $1345/oz. The bulls didn't jump at their chance to break upside at the $1676 level after consolidation. Later this peak became the downtrend touch point. It could be classic ascending triangle pattern, but the market turned sideways shaping a rectangle formation instead.

You can see on the chart how accurately the RSI indicator shows real and false breaks on the market. In 2013, the RSI didn't break the 40 level support twice, while price moved below $1400 support twice. And the market reversed up inside of the rectangle.

This year, the price was squeezed between downtrend resistance and 38.2% Fibonacci retracement at the $1470 level on the upside and the rectangle's support at the $1400 level on the lower side. After impulse accumulated enough power, the market first tried testing the upside, but failed and in September moved down and cracked both the $1400 level rectangle support and the 50% Fibonacci retracement level, the last one only with the 5th attempt.

Platinum swiftly appeared at the 61.8% Fibonacci level at $1221/oz. The price managed to drop below it for a while, but the market closed higher at the $1224 level. Continue reading "Platinum And Palladium Chart Analysis"

Mr. Draghi Fails To Deliver

George Yacik - INO.com Contributor - Fed & Interest Rates


Mario Draghi may have cried wolf one too many times.

I've watched with amazement over the past couple of years as the European Central Bank president has gotten more mileage from saying what he intends or plans to do in the future – without actually having to do it – yet nearly always gets the financial markets to do what he wants them to do.

But, it looks like he ran out of luck on Thursday when he announced at his regular press conference after the ECB's monthly meeting that the bank was going to put off until "early next year" any new measures to try to stimulate the moribund Eurozone economy.

Not surprisingly, the euro surged, sovereign bond yields rose and stock prices plummeted after Draghi’s disappointing remarks. The euro jumped over a penny, or more than 1%, against the dollar while yields on Italian and Spanish 10-year government bonds rose about four basis points. In recent weeks, yields on Eurozone sovereign bonds have dropped to their lowest levels on record on speculation that the ECB would soon start buying up those bonds, as well as those of other countries.

Before the meeting, it had been widely expected that Draghi would announce the ECB will start buying government, and possibly corporate bonds too, to try to boost inflation in the zone. So far it has bought covered bonds and other asset-backed securities, with little in the way of economic improvement to show for it. Indeed, at the ECB's previous meeting in early November, Draghi said the bank would take further steps to increase its balance sheet in order to boost the currency zone's economy, which many took to mean government bond purchases were next on the agenda. Continue reading "Mr. Draghi Fails To Deliver"

Will Silver Drop To $4-5/oz?

Aibek Burabayev - INO.com Contributor - Metals

Gold Chart Analysis

On a monthly chart of gold (FOREX_XAUUSDO), the 6 year cycle has entered the final period after the price peaked in 2011 at $1823 close. A descending continuation triangle pattern has been formed. This suggests that the price will proceed in a downward movement.

This line chart shows monthly market closes and it clearly indicates that the triangle's base was broken at the $1180-$1205 level. The price, already for two consecutive months, managed to close below first support. This signal confirms the pattern.

The target is calculated as the distance of the trend before the Triangle was formed, from the peak in August 2012 close at $1764/oz to the low of May 2013 close at $1243/oz, and projected below the triangle's base. I calculated $700/oz level as the target for our move with simple approximation, which coincides with the 6 year cycle's start or base level. This gives more weight to the power of this level.

There is very tough support between $1200 and $700 levels located at $1000/oz. Firstly, it's an important psychological level and secondly, it is a former stiff resistance which was broken only from a 4th attempt in 2009. Only this level can be a serious obstacle on the way down.

Although we see a clear bearish trend, we can't rule out a pattern breakout or total reversal of the trend.

On the upside, the first good resistance is at the $1300 level which is the triangle's upper side, the second good resistance is $1400 – the triangle's first peak.

Gold 1


Silver Chart Analysis

Let's move onto silver (FOREX_XAGUSDO). Like the previous chart of gold, we see a 6 year fading cycle, but the curve is steeper for silver. And of course, you can see that silver dropped far deeper than the gold. If gold dropped around 40% from it's all time high in 2011, then silver plummeted an impressive 70%! Since silver is less liquid, that would explain its volatility. Silver's price action is a good indicator for gold's future moves. Keep that in mind while you search for trading opportunities.

This metal broke all major supports, including the very important level at $20/oz, which is a former resistance level that couldn't be broken for 3 years in a row. Next was the triangle's base at $19/oz. After it was passed, the price quickly fell to new lows at $15/oz. The target was calculated in the same manner as it was calculated for gold, at $4-5/oz to the downside. I would be very cautious once the price reaches $10/oz. Anywhere a two-digit number turns into a one-digit number is an area of prime psychological importance.


Price can start to be volatile between the $10 and $20 levels, which then acts as resistance for a possible price pullback.

After $20, the next good resistance is located at the $24-$35 level, which is the peak of the triangle.

Silver Analysis


Visit back for my metals analysis next week.

Lucky trades,

Aibek Burabayev
INO.com Contributor, Metals

Disclosure: This contributor has no positions in any stocks mentioned in this article. This article is the opinion of the contributor themselves. The above is a matter of opinion provided for general information purposes only and is not intended as investment advice. This contributor is not receiving compensation (other than from INO.com) for their opinion.

The Carry Trade That’s Set To Unravel

Lior Alkalay - INO.com Contributor - Forex


Carry trade... if that’s the first time you’ve come across that term you should know that "carry trade" is one of the oldest tricks in the books when it comes to foreign exchange trading. It is based on a very basic gap, specifically, the interest rate gap. The way investors use it to create alpha is by borrowing one currency with a lower interest rate and buying with the borrowed cash a currency with a higher one. The investor's gain is created then by the gap between what the borrower pays on the low yielding currency and what he earns on the high yielding currency. Of course, if the currency you buy appreciates in the process that would be even better.

Investors have been making good (i.e. profitable) use of this technique for years using various currencies. For instance, back in the 1990s and 2000s, investors would borrow the Japanese Yen, then buy the U.S. Dollar or Euro. Or as in the 2009-2010 period, they’d borrow the U.S. Dollar and buy the Euro (of course, back then rates were much higher). Usually, this would create inflows for the higher yielding currencies and as such lead to the currency’s appreciation. But what happens when this rate gap is threatened? As Euro bulls discovered just recently, it can create a meltdown of the trade rather quickly and the trend can reverse course just as fast. So, why am I telling you this? Why the sudden dive into the mechanics of the carry trade? Because just as you are reading those very words, a big carry trade is set to unravel and as it does, the trend it created is set up to reverse as well.

The Aussie Kiwi Carry Trade

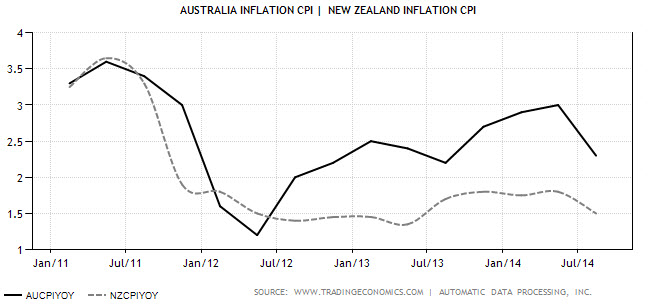
One of most prominent carry trades of the past two years has revolved around the currencies of two neighboring countries, Australia and New Zealand. Ever since China’s economy began slowing and the commodity space began its bearish cycle, the Australian economy has likewise been slowing and, of course, as a result interest rates were cut to prevent the Aussie economy from further deterioration. However, while Australia suffered a slowdown, New Zealand, its smaller neighbor, has been faring well and growing above trend, thanks in large part to a prosperous dairy industry. Naturally, this created an interest rate deferential which is illustrated below and, as you might have guessed, a big carry trade that led the AUD/NZD to an utter collapse of 20.9% until it reached a multi-year low of 1.049. Yet, now as the pair is trading close to its record low, there are tentative signs emerging which suggest a turnaround could be in the making. This could lead the trend to reverse and allow investors to potentially bank on a big rebound of the AUD/NZD. Image courtesy of TradingEconomics.com.

New Zealand Interest Rate - Dec 2014

The Trend Unravels

So, why is the trend on the verge of unraveling? In one word: inflation. If Australia had lower interest rates along with a rate of inflation lower than New Zealand’s own, the trend would have no reason to reverse. Australian interest rates would remain low (or else be at risk of dropping lower), while New Zealand would have rising inflationary pressures that would justify higher rates. But that is not the case at all. In fact, Australia’s annual inflation rate is more than double New Zealand’s. Aussie inflation was reported at 2.3% YoY while New Zealand’s inflation stands at a mere 1%, and that is in spite of the one-off effect of a reduction in Australia’s electricity tax that lowered inflation. In other words, while interest rates in Australia are much lower, the inflation rate is much higher, shaking the fundamentals of the trend. This means that while the Reserve Bank of Australia (RBA) has neither the space nor the rationale for easing, the Reserve Bank of New Zealand (RBNZ) has at least one reason to cut rates and none to raise them, leaving the fundamentals of the short AUD/NZD to crumble and open the space for a rebound. Image courtesy of TradingEconomics.com.

Australia Inflation CPI

Price and Projections

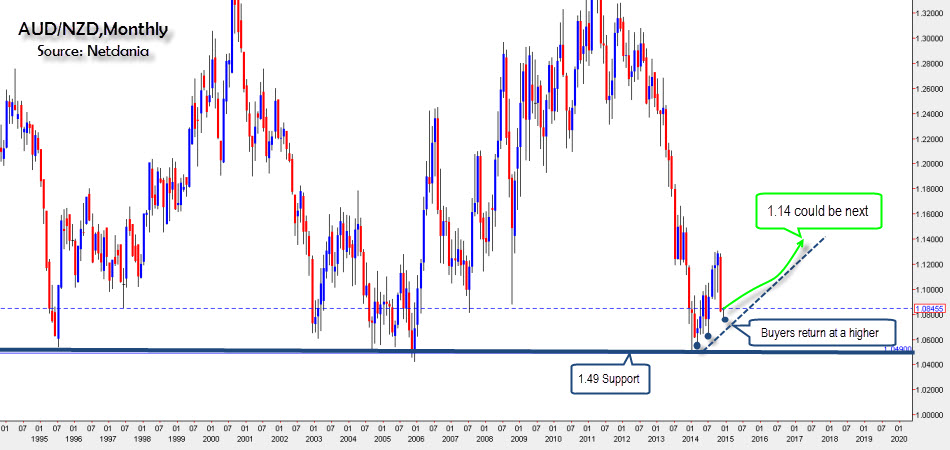
But now, there’s one final question, does the market show signs of a trend reversal in the AUD/NZD? The answer is yes. As seen below, each and every time the pair moved nearer to its record low of 1.049, buyers emerged. In fact, since the beginning of the year, buyers for AUD/NZD seem to reemerge, each time at a higher point, signaling a clear, albeit slow, sentiment shift. However, given that the RBNZ rate decision is set to take place next week and considering that the RBA took a decidedly neutral turn this week, the likelihood of an AUD/NZD trend reversal is on the rise, especially as the RBNZ governor continues, time and again, to point out that the Kiwi Dollar is "unjustifiably high." If that winds up being the case next week as well, that trend reversal could quickly accelerate. And as far as projections go? Looking at the chart, logically, we could be looking at a reversal toward at least 1.14 as this Aussie Kiwi carry trade unravels over the next couple of months.

AUD/NZD Monthly

Look for my post next week.

Best,

Lior Alkalay
INO.com Contributor - Forex

Disclosure: This article is the opinion of the contributor themselves. The above is a matter of opinion provided for general information purposes only and is not intended as investment advice. This contributor is not receiving compensation (other than from INO.com) for their opinion.