Platinum And Palladium Chart Analysis

Aibek Burabayev - INO.com Contributor - Metals


Platinum Monthly Chart Analysis

Platinum fell in a downtrend in 2011 after the price formed a reversal double top pattern, which was confirmed on the RSI. Price rapidly reached $1400/oz, scoring $445 for the bears. The market easily overcame 23.6% and 38.2% Fibonacci retracement levels, but was stopped in four consecutive attempts by a very hard 50% level at $1345/oz. The bulls didn't jump at their chance to break upside at the $1676 level after consolidation. Later this peak became the downtrend touch point. It could be classic ascending triangle pattern, but the market turned sideways shaping a rectangle formation instead.

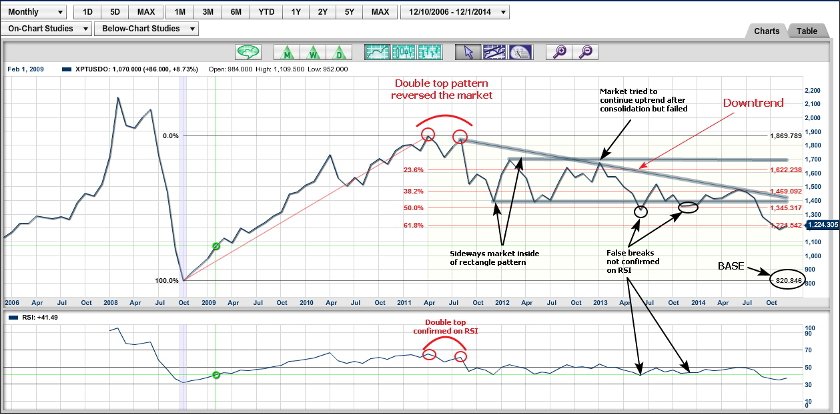
You can see on the chart how accurately the RSI indicator shows real and false breaks on the market. In 2013, the RSI didn't break the 40 level support twice, while price moved below $1400 support twice. And the market reversed up inside of the rectangle.

This year, the price was squeezed between downtrend resistance and 38.2% Fibonacci retracement at the $1470 level on the upside and the rectangle's support at the $1400 level on the lower side. After impulse accumulated enough power, the market first tried testing the upside, but failed and in September moved down and cracked both the $1400 level rectangle support and the 50% Fibonacci retracement level, the last one only with the 5th attempt.

Platinum swiftly appeared at the 61.8% Fibonacci level at $1221/oz. The price managed to drop below it for a while, but the market closed higher at the $1224 level. Continue reading "Platinum And Palladium Chart Analysis"

A Four-Chart Lesson in Spotting Trade Setups

By Elliott Wave International

You can find low-risk, high-confidence trading opportunities by trading with the trend. The trick is to find the end of market corrections, so you can position yourself for the next move in the direction of the trend.

This excerpt from Jeffrey Kennedy's free 47-page eBook How to Spot Trading Opportunities explains where to find bullish and bearish trade setups in your charts and how to zero-in on these opportunities. If this lesson interests you, the full 47-page eBook is free through July 16. Continue reading "A Four-Chart Lesson in Spotting Trade Setups"

Gold and the New Technical Triad

Today's guest is Gary Wagner featured Trend TV author and founder of Wfgforex.com. Gary is going to share with us part 3 of his  "Gold and the New Technical Triad" with traders blog readers. Be sure to comment with your thoughts on the gold market.

--------------------------------------------------------------------------------------------------------------------------------------------------------------------------------------

Gold which has been trading higher the past few weeks is, I believe, is in a correction within a corrective phase. That is to say it is going against the short term trend as it moves higher. I am fundamentally extremely bullish on gold, and in fact believe that it will surpass 1265 and trade to 1300 an ounce. However, before we get there I think we will need to weather one last correction.

In this, part three of a blog I began on may 13, 2010, we've followed gold as it now enters the final portion of this corrective phase. I believe that in the proper hands, wave theory will provide genuine and relevant market insights, and in the wrong hands will enable a lot of skeptic’s added reasons to doubt this technique. For those who have are skeptical about the relevance of Elliot wave, I hope that this blog might cause you to re-examine this technique again.

Continue reading "Gold and the New Technical Triad"

Elliot Wave, Fibonacci and, Candlesticks: Part 2

Today's guest is Gary Wagner of The Forex Gold Forecast who shared shared part one of his unique triple-play of forex gold analysis in a blog post titled, "A New Technical Triad and Gold". In part 2 of his strategy, Gary explores what is now happening in the gold market and what we might expect before fall.

We hope you enjoys today's post and leave your comments for Gary below.

-------------------------------------------------------------------------------------------------------------------------------------------------------

Where Might Gold Head This Summer

Trading the gold market might look easy when you consider that it has gone up $282 dollars in one year. However anyone involved in gold trading whether it be through Comex, Forex or Eft’s will tell you different.  This is part 2 of a blog which began on May 13, 2010 (you can find that post here).  In part one we spoke about the relevance of using Elliot wave, Fibonacci retracement and candlestick patterns as 3 tools well suited for market analysis and forecasting gold prices. This part two will continue where we left off. On May 13th we were nearing the top of wave 3 in Forex gold. Since that time we have completed that wave, seeing gold trade to a new historical high of first 1248, then after a correction (wave 4) to a new all time high in wave 5 of 1265.

Continue reading "Elliot Wave, Fibonacci and, Candlesticks: Part 2"

A New Technical Triad and Gold

One of the most popular questions that we're asked here at MarketClub is to recommend which chart studies should be used in conjunction with one another. While we don't have an answer for this question - mainly because we realize that there is no right answer, you're in luck as today's guest blogger has developed a strategy using 3 different technical tools and described it in detail for us below.

Gary Wagner of WFGForex.com has developed a unique strategy using Elliot Waves, Fibonacci retracements, and candlesticks to gain insight on the current gold market. Since Gary received such a great response last time he was a guest, we hope that you will enjoy is newest post as well. Read about this interesting way of analyzing the market and leave your comment below.

-----------------------------------------------------------------------------------------------------------------------------------

Most market analysts will agree that supply and demand economics are a major influence on the current price of a commodity. It is however market sentiment that greatly determines the perceived future price.  If one can understand, and quantify market psychology or market sentiment, one can more effectively forecast future prices. This has been the underlining assumption of Elliot Wave and Fibonacci Retracement theory. Continue reading "A New Technical Triad and Gold"