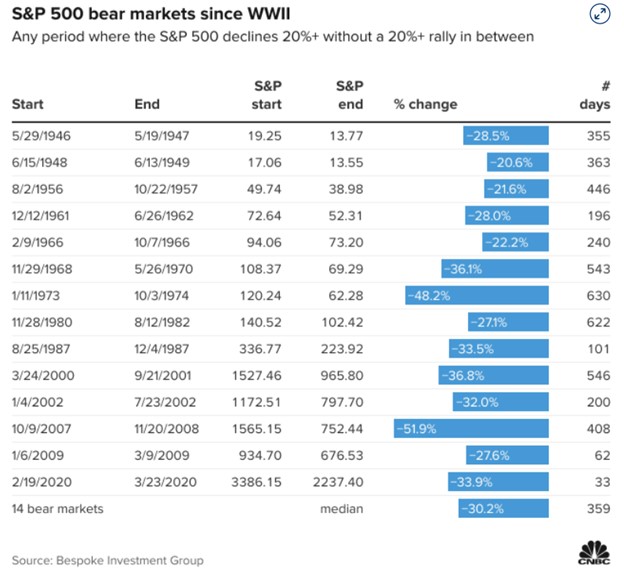
No Place To Hide
A massive amount of portfolio wealth has been destroyed throughout this bear market that continues its carnage that started in January. Except for oil stocks, there hasn't been any place to hide, as the cryptocurrency market, gold, equities, and bonds have all scummed to the mauling of the bear. The current bear market has been brutal, with some individual stocks losing more than 90% of their value, such as Peloton (PTON), Beyond Meat (BYND), Coinbase (COIN), and Zoom Video (ZM). However, even high-quality large-cap companies with growing revenues and durable business models have not been spared and have sold off 30-50%, such as Disney (DIS), Microsoft (MSFT), Adobe (ADBE), Costco (COST), and Meta (FB).
During bear markets or an extended period of a market-wide correction, investors have the unique opportunity to purchase heavily discounted stocks at a fraction of the price compared to their peaks. As history indicates, establishing long-term positions during corrections can lead to outsized gains over the intermediate and long term. As the selling pressure abates and the macroeconomic backdrop resolves, building equity stakes in high-quality companies bodes well for investors. The most recent market-wide sell-off is due to a confluence of the China Covid lockdowns, the Russia/Ukraine war, persistent inflation, and rising rates. As these macro issues resolve over time, the markets will regain their footing and appreciate higher. The current market backdrop is the exact scenario where investors should be deploying cash on hand to snap up heavily discounted merchandise.
Cash Is King
Deploying cash into an environment where the selling is relentless and indiscriminate can be a daunting task. However, for any portfolio structure, having cash on hand is essential and in these environments is where this cash should be deployed in equities. This cash position provides investors with flexibility and agility when faced with market corrections. Cash enables investors to be opportunistic and capitalize on stocks that have sold off and have become de-risked. Initiating new positions and dollar cost averaging during these extended periods of weakness are great long-term drivers of portfolio appreciation. Absent any systemic risk; there are a lot of fantastic entry points for many high-quality large cap companies. Investors should not be remiss and capitalize on this buying opportunity because it may not last too long.
Anchoring And Dollar Cost Averaging
Purchasing stocks at the exact bottom is nearly impossible; however, purchasing stocks at attractive valuations in a disciplined manner over time is possible. For example, dollar cost averaging is a great strategy when anchoring down into a position with an initial sum of capital and following through with additional incremental purchases as the stock declines further. The net benefit is reducing the average purchase price per share in a sequential fashion (i.e., reducing cost basis). An example of building out a high-quality portfolio with subsequent dollar cost averaging throughput this market weakness can be seen in Figure 1.
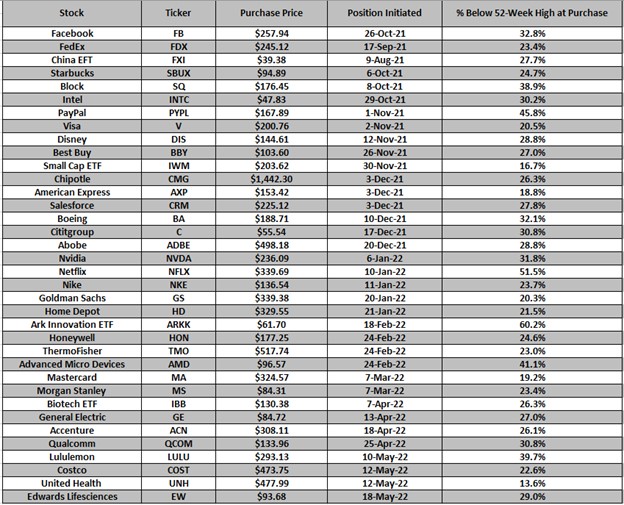
Figure 1 – Initiating positions in high-quality companies with subsequent dollar cost averaging to lower the average purchase price over time. These long equity trades along with options-based trades can be found via the Trade Notification service
Conclusion
Purchasing stocks at the exact bottom is nearly impossible; however, purchasing stocks at attractive valuations in a disciplined manner over time is possible. During bear markets, investors have the unique opportunity to purchase heavily discounted stocks at a fraction of the price compared to their peaks. As history indicates, establishing long-term positions during corrections can lead to outsized gains over the intermediate and long term. As the selling pressure abates and the macroeconomic backdrop resolves, building equity stakes in high-quality companies bodes well for investors. The current market backdrop is the exact scenario where investors should be deploying cash on hand to snap up heavily discounted merchandise.
Having cash on hand is essential and in this environment is where this cash should be deployed in equities. This cash position provides investors with flexibility and agility when faced with market corrections. Cash enables investors to be opportunistic and capitalize on stocks that have sold off and have become de-risked. Initiating new positions and dollar cost averaging during these extended periods of weakness are great long-term drivers of portfolio appreciation.
Noah Kiedrowski
INO.com Contributor
Disclosure: Stock Options Dad LLC is a Registered Investment Adviser (RIA) firm specializing in options-based services and education. There are no business relationships with any companies mentioned in this article. This article reflects the opinions of the RIA. Any recommendation contained in this article is subject to change at any time. No recommendation is intended to constitute an entire portfolio. The author encourages all investors to conduct their own research and due diligence prior to investing or taking any actions in options trading. Please feel free to comment and provide feedback; the author values all responses. The author is the founder and Managing Member of Stock Options Dad LLC – A Registered Investment Adviser (RIA) firm www.stockoptionsdad.com defining risk, leveraging a minimal amount of capital and maximizing return on investment. For more engaging, short-duration options-based content, visit Stock Options Dad LLC’s YouTube channel. Please direct all inquires to
in**@st*************.com
. The author holds shares of AAPL, ACN, ADBE, AMD, AMZN, ARKK, AXP, BA, BBY, C, CMG, COST, CRM, DIA, DIS, EW, FB, FDX, FXI, GOOGL, GS, HD, HON, IBB, INTC, IWM, JPM, LULU, MA, MS, MSFT, NKE, NVDA, PYPL, QCOM, QQQ, SBUX, SPY, SQ, TMO, UNH and V.