Natural Gas: Opportunity of the Year?

It's difficult to imagine that this energy commodity could offer a promising opportunity for profit when you observe its performance across different timeframes, including yearly, half-yearly, and even year-to-date. Below is a chart displaying its performance over the course of one year.

NG Futures 1Y Performance

Source: finviz.com

Natural gas futures have performed the worst among all commodities on the mentioned timeframes, losing 73% of their price in one year. They are almost double the percentage loss of the next worst-performing commodity, oats futures.

The chart below sheds light on the poor performance of natural gas futures. Continue reading "Natural Gas: Opportunity of the Year?"

And You Thought Gasoline And Diesel Prices Were High

“The following is an excerpt from Tim Snyder’s “Weekly Quick Facts” newsletter. Tim is an accomplished economist with a deep understanding of applied economics in energy. We encourage you to visit Matador Economics and learn more about Tim. While there, you can sign up for his completely free Daily Energy Briefs and Weekly Quick Facts newsletters.”

I was asked last week, after our series on gasoline and diesel prices and how high those prices could go, my thoughts on the price of Natural Gas, and where they could go.

I have been following Natural Gas prices and Natural Gas inventories for years, so I went to my trusty charts and began to piece together a narrative.

Just this year alone, the price of Natural Gas has doubled. We started the year at $3.73 per million cubic feet (MMCF) and closed business yesterday, at $8.796 per MMCF. Here’s that
price chart:

Natural Gas Futures

I also looked at the inventory chart for Natural Gas from the Energy Information Agency. That chart showed me that natural gas inventories are starting to trend toward the lower end of the five-year average. Continue reading "And You Thought Gasoline And Diesel Prices Were High"

Weekly Futures Recap With Mike Seery

We've asked Michael Seery of SEERYFUTURES.COM to give our INO readers a weekly recap of the Futures market. He has been a Senior Analyst for close to 15 years and has extensive knowledge of all of the commodity and option markets.

Michael frequently appears on multiple business networks including Bloomberg news, Fox Business, CNBC Worldwide, CNN Business, and Bloomberg TV. He is also a guest on First Business, which is a national and internationally syndicated business show.

Crude Oil Futures

Crude oil futures in the April contract settled last Friday in New York at 35.92 while currently trading at 38.90 a barrel up around $3 for the trading week continuing its bullish momentum as prices have now hit a 9 week high. Crude is trading above its 20 day but right at its 100 day moving average as the trend is still relatively mixed in my opinion as the commodity markets in general have all bottomed out as volatility certainly has come back into the currency market pushing the commodity markets like a yo-yo in recent weeks. Continue reading "Weekly Futures Recap With Mike Seery"

Natural Gas Takes Its Turn At The Puke Bowl

Adam Feik - INO.com Contributor - Energies


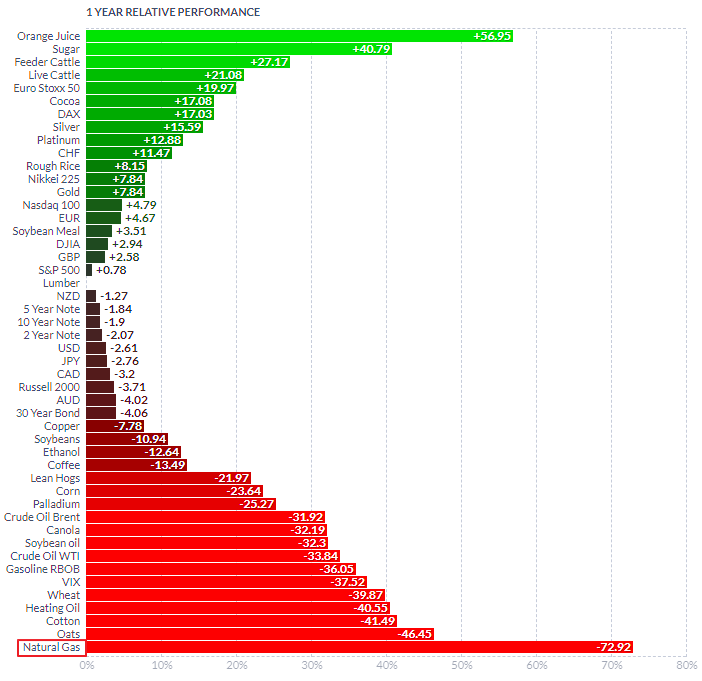
Natural gas futures on Friday dropped below $3 for the first time since September 2012, on an intraday basis. December is now on track for the dubious distinction of producing natty’s largest one-month drop since 2008 – currently about a 26% month-to-date (MTD) decline – as producers continue churning out the commodity even while mild weather has resulted in below-normal consumption.

Crude oil, by comparison, has declined about 17% in December (MTD).

Natural gas and crude oil prices have taken turns out-dropping each other over the past 6 months. This simple graph (and accompanying chart) shows how oil and gas have crashed both together and separately for the last 6 months. What do I mean by that? Both have nosedived, but with 5 distinct periods of divergence (highlighted in blue when oil is outperforming, and highlighted in red when gas is outperforming). See for yourself:
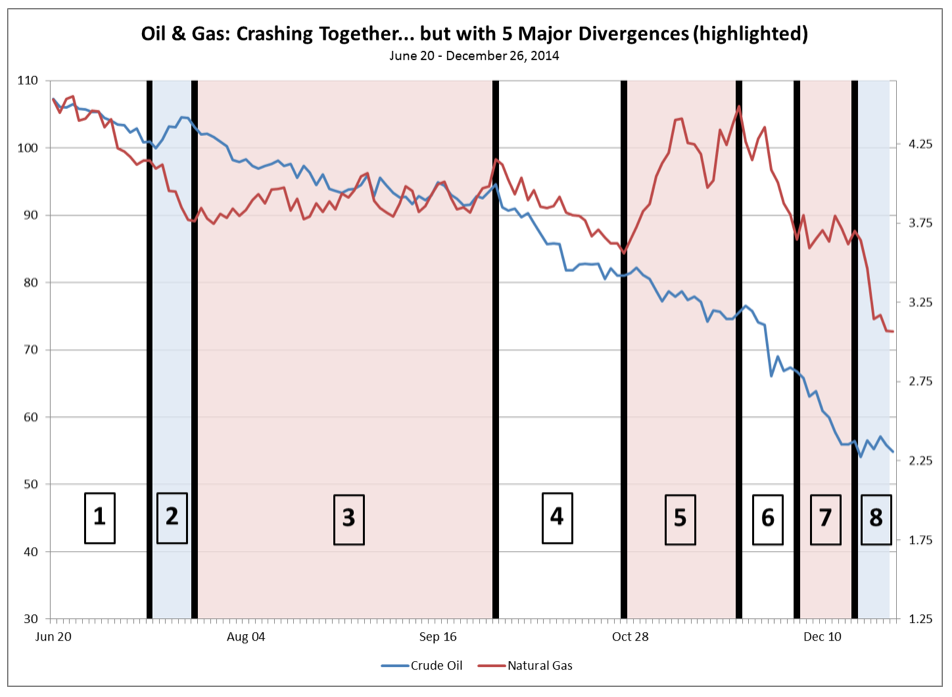
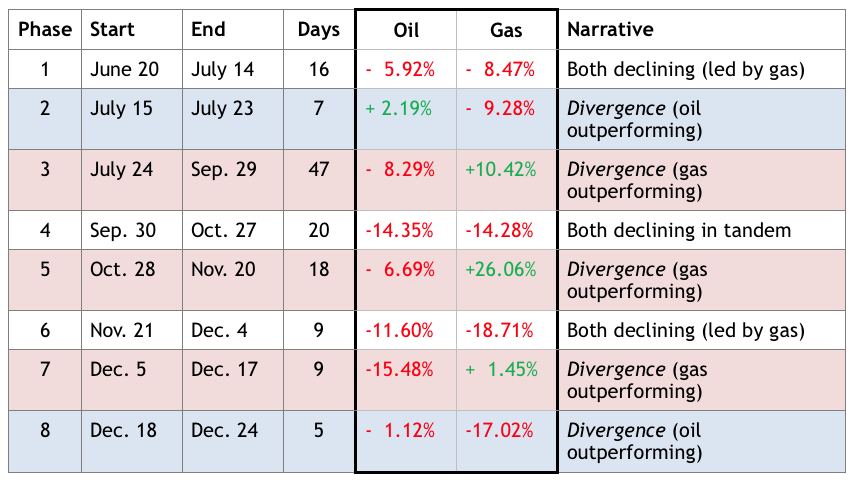
In total:

  • Oil & gas have crashed “together” for 3 of the 8 periods, for a total of 45 trading days in which gas has generally declined more than oil.
  • Oil has “diverged” to the upside in 2 periods (highlighted in blue), for a total of 12 trading days.
  • Gas has “diverged” to the upside in 3 periods (highlighted in red), for a total of 74 trading days.

Actually, at its recent peak on Nov. 20th, natural gas prices were only a few pennies below their June 20th level; so effectively all of natty’s 2014 crash has occurred in just over 23 trading days since just before Thanksgiving.

What happened to natural gas from Oct. 28th through Nov. 20th, when it rose about 26%? Continue reading "Natural Gas Takes Its Turn At The Puke Bowl"

Chart of The Week - Natural Gas

Each Week Longleaftrading.com will be providing us a chart of the week as analyzed by a member of their team. We hope that you enjoy and learn from this new feature.

To start the week, we will be watching Natural Gas futures closely. July Natural Gas saw a spike higher overnight to $4.89, but gave back those gains in the early morning hours. There is a measure of support in the market as Russia has halted Natural Gas flows to the Ukraine. Along with halted Natural Gas flows to the Uklraine, the US Natural Gas storage remains tight and sits well below the 5 year average. With a warmer weather outlook across the US, the case can be made for a bullish week in Natural Gas.

On the technical side, Natural Gas has sold off to a critical area of support at $4.70. This bullish trend-line was broken in mid-May and since become resistance in the market. After last week’s EIA inventory report on Thursday morning, the market spiked back above this trend-line with closes above it on both Thursday and Friday. In today’s session, Continue reading "Chart of The Week - Natural Gas"