Gold Chart Analysis
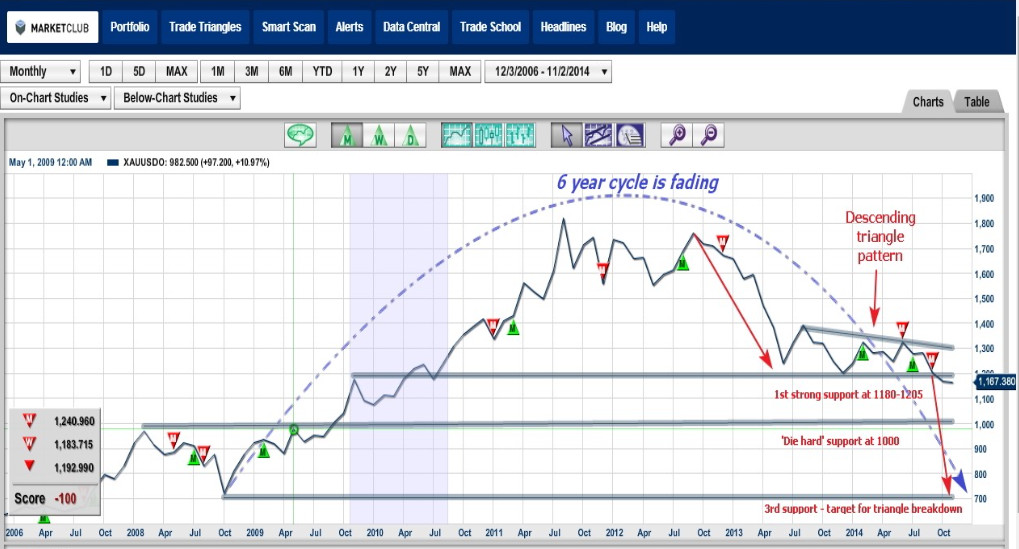
On a monthly chart of gold (FOREX_XAUUSDO), the 6 year cycle has entered the final period after the price peaked in 2011 at $1823 close. A descending continuation triangle pattern has been formed. This suggests that the price will proceed in a downward movement.
This line chart shows monthly market closes and it clearly indicates that the triangle's base was broken at the $1180-$1205 level. The price, already for two consecutive months, managed to close below first support. This signal confirms the pattern.
The target is calculated as the distance of the trend before the Triangle was formed, from the peak in August 2012 close at $1764/oz to the low of May 2013 close at $1243/oz, and projected below the triangle's base. I calculated $700/oz level as the target for our move with simple approximation, which coincides with the 6 year cycle's start or base level. This gives more weight to the power of this level.
There is very tough support between $1200 and $700 levels located at $1000/oz. Firstly, it's an important psychological level and secondly, it is a former stiff resistance which was broken only from a 4th attempt in 2009. Only this level can be a serious obstacle on the way down.
Although we see a clear bearish trend, we can't rule out a pattern breakout or total reversal of the trend.
On the upside, the first good resistance is at the $1300 level which is the triangle's upper side, the second good resistance is $1400 – the triangle's first peak.

Silver Chart Analysis
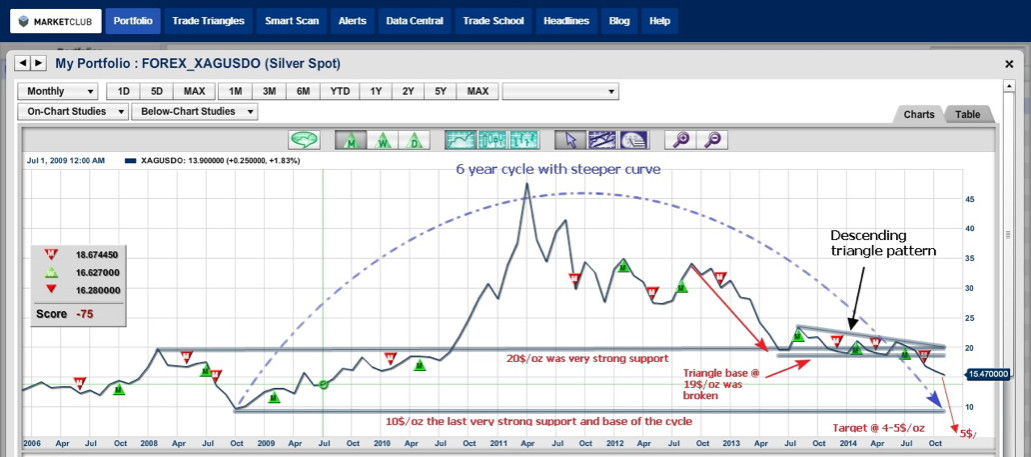
Let's move onto silver (FOREX_XAGUSDO). Like the previous chart of gold, we see a 6 year fading cycle, but the curve is steeper for silver. And of course, you can see that silver dropped far deeper than the gold. If gold dropped around 40% from it's all time high in 2011, then silver plummeted an impressive 70%! Since silver is less liquid, that would explain its volatility. Silver's price action is a good indicator for gold's future moves. Keep that in mind while you search for trading opportunities.
This metal broke all major supports, including the very important level at $20/oz, which is a former resistance level that couldn't be broken for 3 years in a row. Next was the triangle's base at $19/oz. After it was passed, the price quickly fell to new lows at $15/oz. The target was calculated in the same manner as it was calculated for gold, at $4-5/oz to the downside. I would be very cautious once the price reaches $10/oz. Anywhere a two-digit number turns into a one-digit number is an area of prime psychological importance.
Price can start to be volatile between the $10 and $20 levels, which then acts as resistance for a possible price pullback.
After $20, the next good resistance is located at the $24-$35 level, which is the peak of the triangle.

Visit back for my metals analysis next week.
Lucky trades,
Aibek Burabayev
INO.com Contributor, Metals
Disclosure: This contributor has no positions in any stocks mentioned in this article. This article is the opinion of the contributor themselves. The above is a matter of opinion provided for general information purposes only and is not intended as investment advice. This contributor is not receiving compensation (other than from INO.com) for their opinion.


