Bitcoin Buy Setup In Profit Range

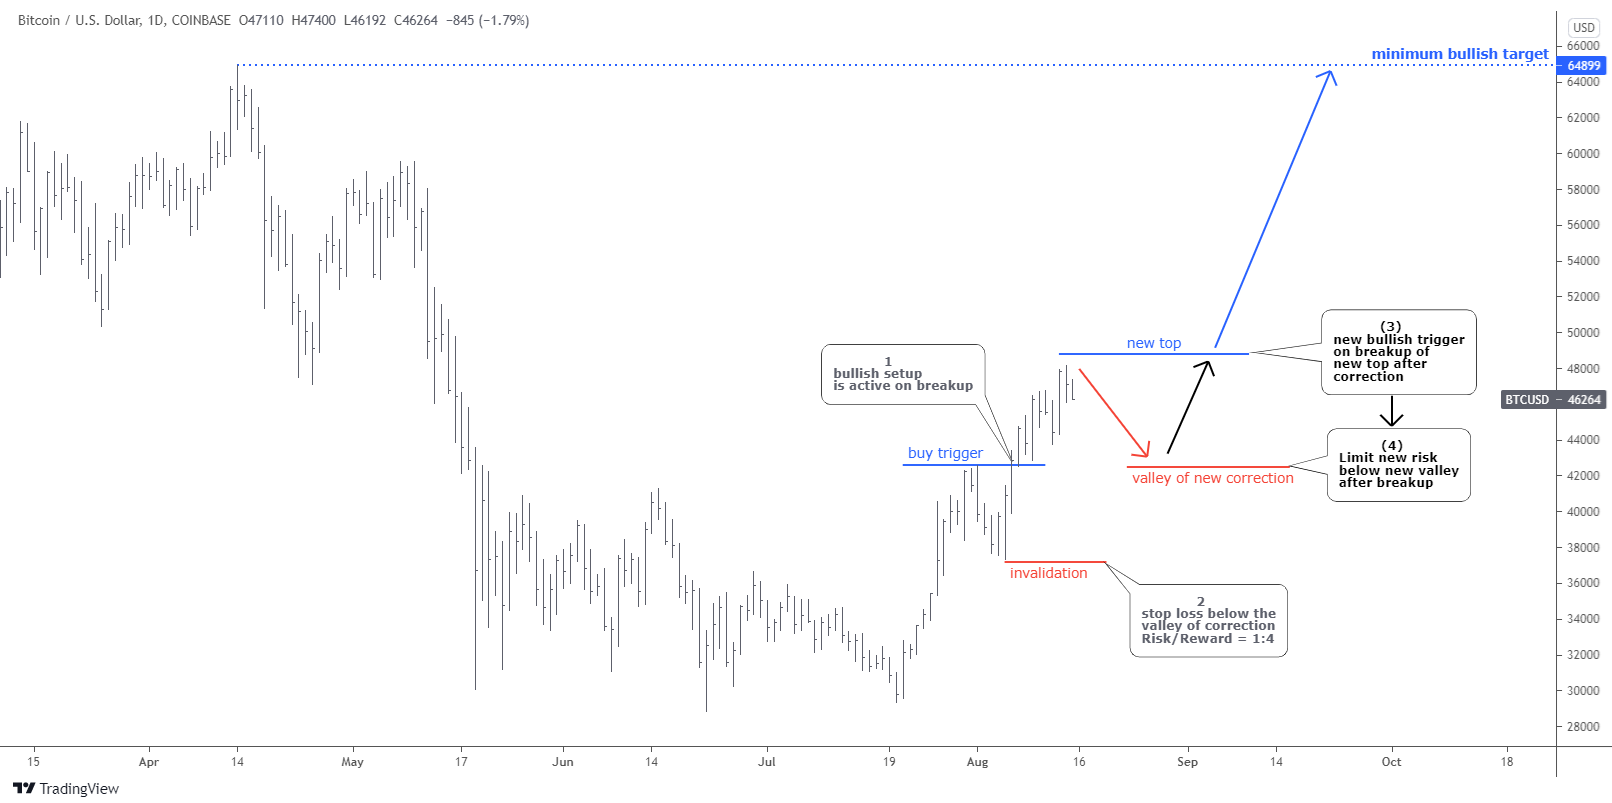
It looks like I have posted the Bitcoin Bullish Setup at the right time as the price precisely followed the preset path - first down into a correction, which hit the minimum area of 38.2% Fibonacci retracement level. Then up to break above the first minor top, that activated the buy trade setup.

The majority of readers were bullish, with 61% votes.

Bitcoin Daily Chart

We can see the clear difference between outlooks and setups. I posted both the Bullish setup and the Bearish setup in case the correction would be extended. They were based on opposite outlooks. We do not have to guess; we wait for which setup would work. Continue reading "Bitcoin Buy Setup In Profit Range"

Copper Is On The Verge

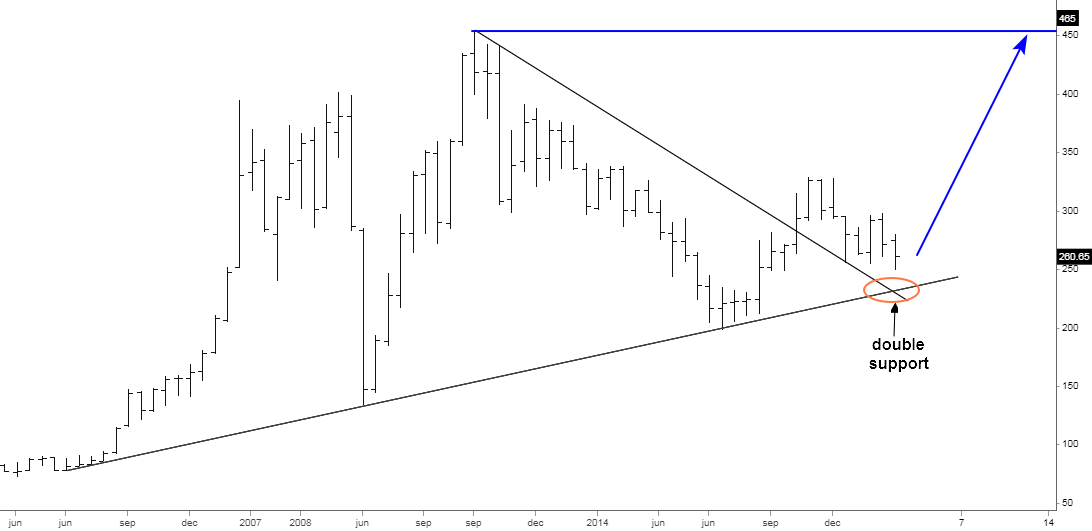
Almost two years ago, in my previous copper update, I called for a big jump of the metal’s price to an ambitious target of $4.65 in the quarterly chart. I put it below to refresh the memory.

Copper Chart

Firstly, the price collapsed to pierce the double support shown in the chart. Only after that, it quickly rebounded to the upside as it hit the preset target of $4.65 this May. I hope you enjoyed that long rally.

Another model, posted almost three years ago within an educational experiment advanced very well, although it did not hit the target yet, as did the pattern shown above. That charting exercise drew a lot of attention and feedback at that time. Moreover, the majority of readers bet on this well-known pattern. Continue reading "Copper Is On The Verge"

Bitcoin Update: Reversal Or "Dead Cat Bounce"?

Bitcoin was in the “To Be Or Not To Be” situation last month as the giant Head & Shoulders pattern emerged to target the utter annihilation of Bitcoin.

This strong support that most of you have shown in the last poll for the main coin kept it from the collapse into the abyss. Let me show you on the chart below what has happened with the terrifying pattern since then.

Bitcoin Head And Shoulders Chart

The model looked just perfect as the price reached the final trigger of the Neckline after building the anticipated Right Shoulder to accumulate enough power for the breakdown. However, the first attempt in late June has failed. The next attempt at the end of July was not as powerful as the angle of attack was not sharp enough, and momentum quickly evaporated after a false breakdown. Continue reading "Bitcoin Update: Reversal Or "Dead Cat Bounce"?"

Platinum And Silver Update

One of our regular readers kindly requested the update of Platinum chart. Here we go as promised.

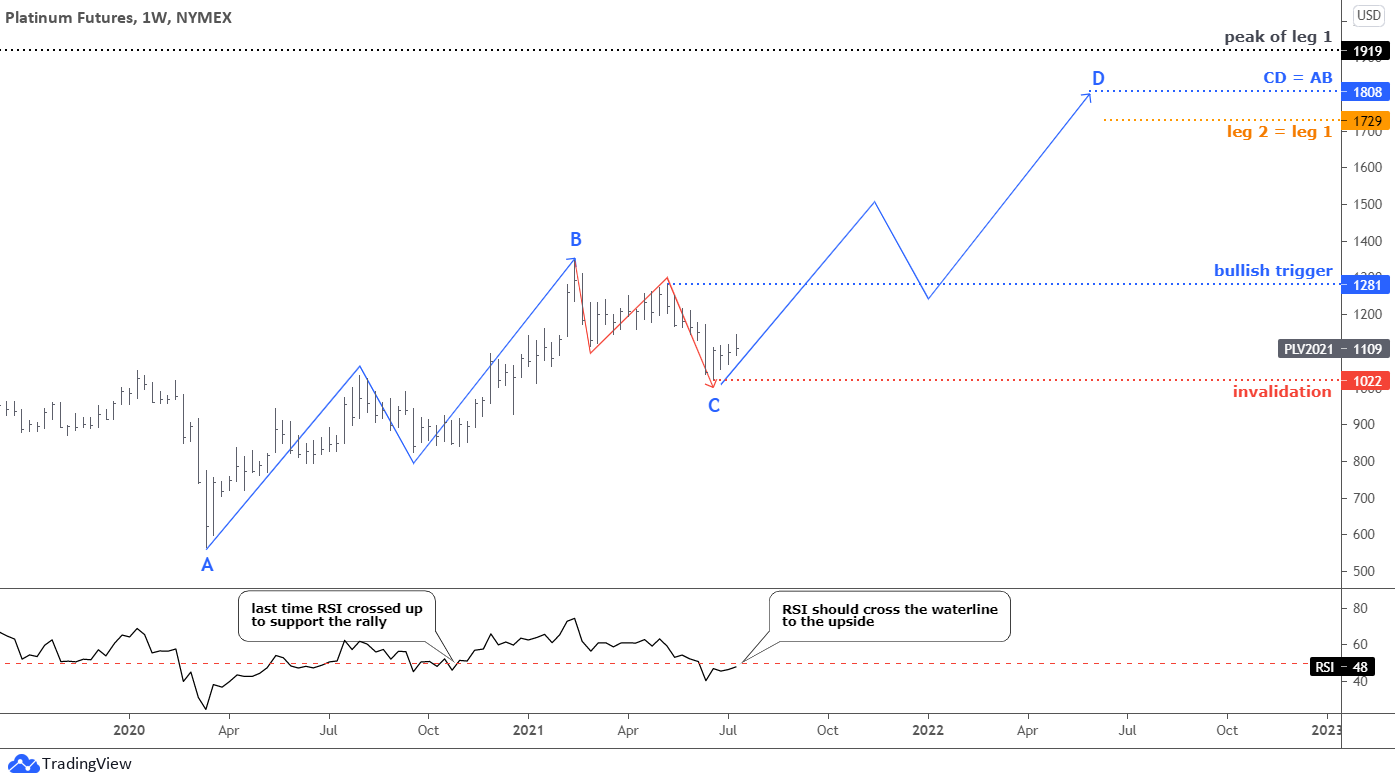
The global outlook for platinum posted in 2019 remains unchanged and you could see that big chart at this link. The previous update was this February as I used the cloning technique to visualize the current second leg up. Platinum futures prices did not follow it, therefore, below is the updated chart.

Weekly Platinum Chart

The leg 2 up had started with a two-leg zigzag up labeled as a blue AB part. It looks symmetric as both legs are almost equal and have the same trajectory. Then we can clearly distinguish the BC consolidation part, which consists of two legs down (red zigzag). It pierced the 38.2% Fibonacci retracement level to hit the valley of $1022. The RSI dropped slightly below the crucial 50 level. Continue reading "Platinum And Silver Update"

Palladium Futures To $4,628?

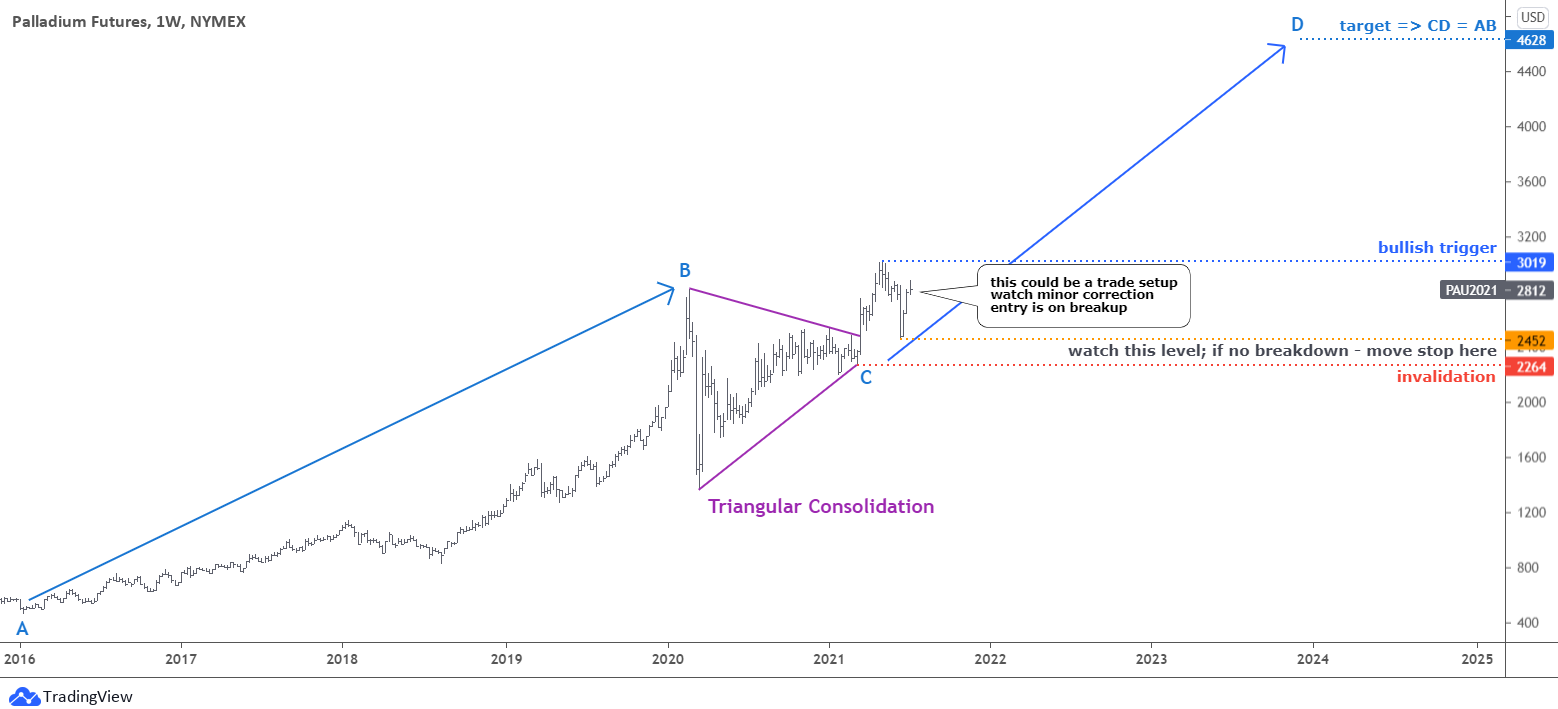
Last summer I spotted a hot trading opportunity for you with 45% potential gain as Palladium futures were set to retest the all-time high. The progress was not as nimble as I thought; however, the target was reached this April as the price even overlapped it. Most of you supported that option, and I hope you enjoyed that gain.

Weekly palladium Chart

It looks like this champion metal offers another stunning opportunity for traders.

The crawling move to the upside since 2016 with a rocket style ending in 2019-2020 was marked as AB part. Continue reading "Palladium Futures To $4,628?"