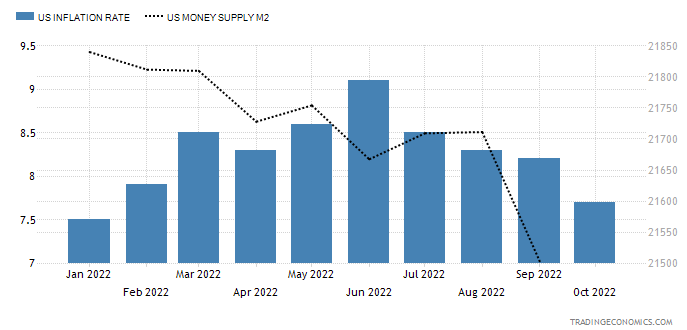
The gold futures have skyrocketed on better than expected U.S. inflation data last week. The annual inflation rate in the U.S. slowed for a fourth month to 7.7% in October, the lowest reading since the start of a year, and well below forecasts of 8%.
According to logic, the gold price should fall as anti-inflationary tightening measures have shown positive results in cooling price growth. The printing press, represented by the M2 money supply indicator (black dotted) in the chart above, has stopped and the reading is declining as well.
Let us check the chart below to look for an answer in the fundamental data of world gold demand.

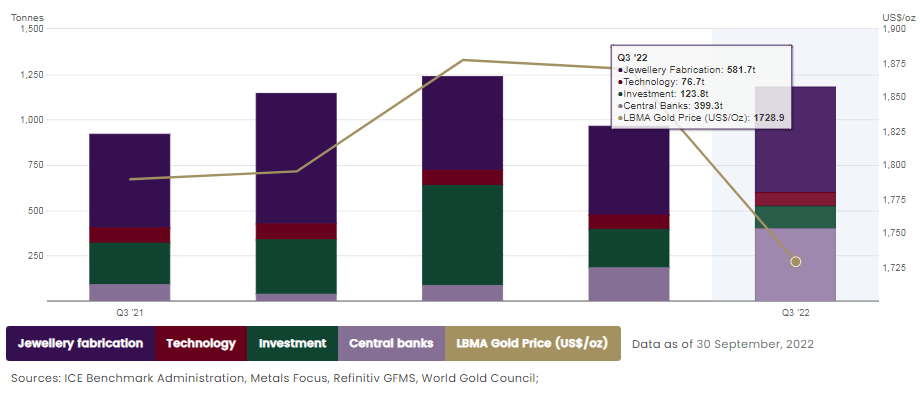
The graph above shows the quarterly data of demand statistics in the period from Q3 2021 to Q3 2022. According to the data, the most stable demand source comes from a technology side (wine-colored). The jewelry demand (dark purple) is price sensitive: it shrinks on the rising price and expands during price falls. The investment demand (dark green) is cooling down amid the tightening as per the logic I explained above. Continue reading "Can Central Banks See What We Don't?"


