Weekly Stock Market Forecast

This week we have a stock market forecast for the week of 4/25/21 from our friend Bo Yoder of the Market Forecasting Academy. Be sure to leave a comment and let us know what you think!

The S&P 500 (SPY)
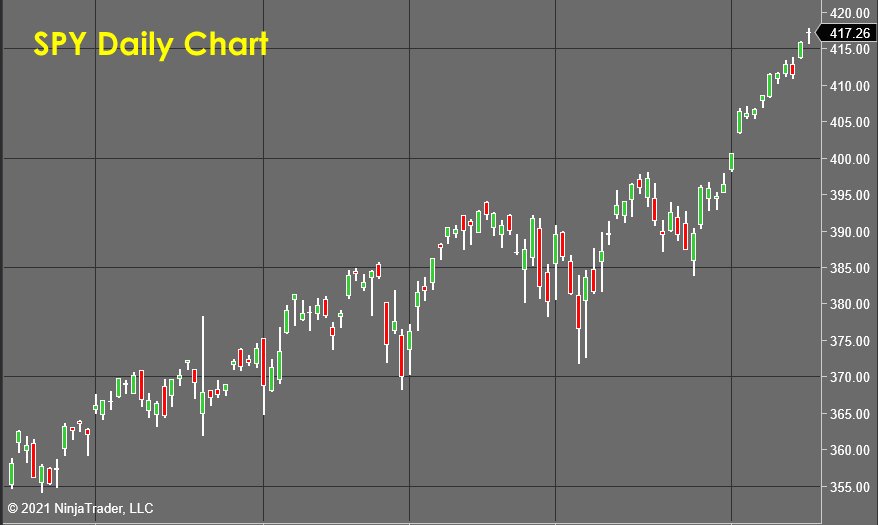
SPY Daily Chart - Stock Market Forecast

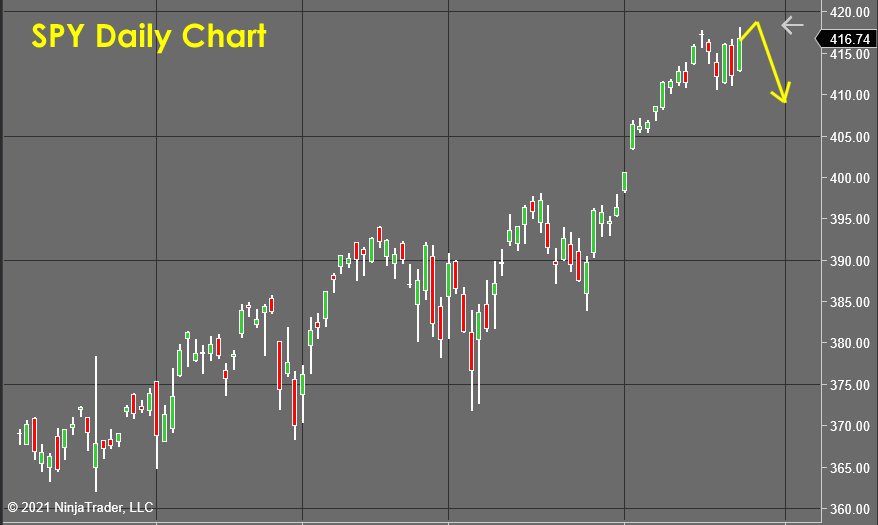
After the market’s recent Fed-induced “melt-up,” S&P 500 (analyzed here using SPY) is processing a new short-term top as traders react to its absurdly overbought levels.

My short-term forecast is as seen in the daily chart here. The rally will likely find strong resistance and begin to either correct or form a range near highs. Continue reading "Weekly Stock Market Forecast"

Gold & Silver: The Dollar Shows The Way

The U.S. dollar index (DXY), aka “King,” has a clear structure in its chart as it moves accurately according to the plan posted at the beginning of the month. Most of you supported the idea that the dollar will show another drop.

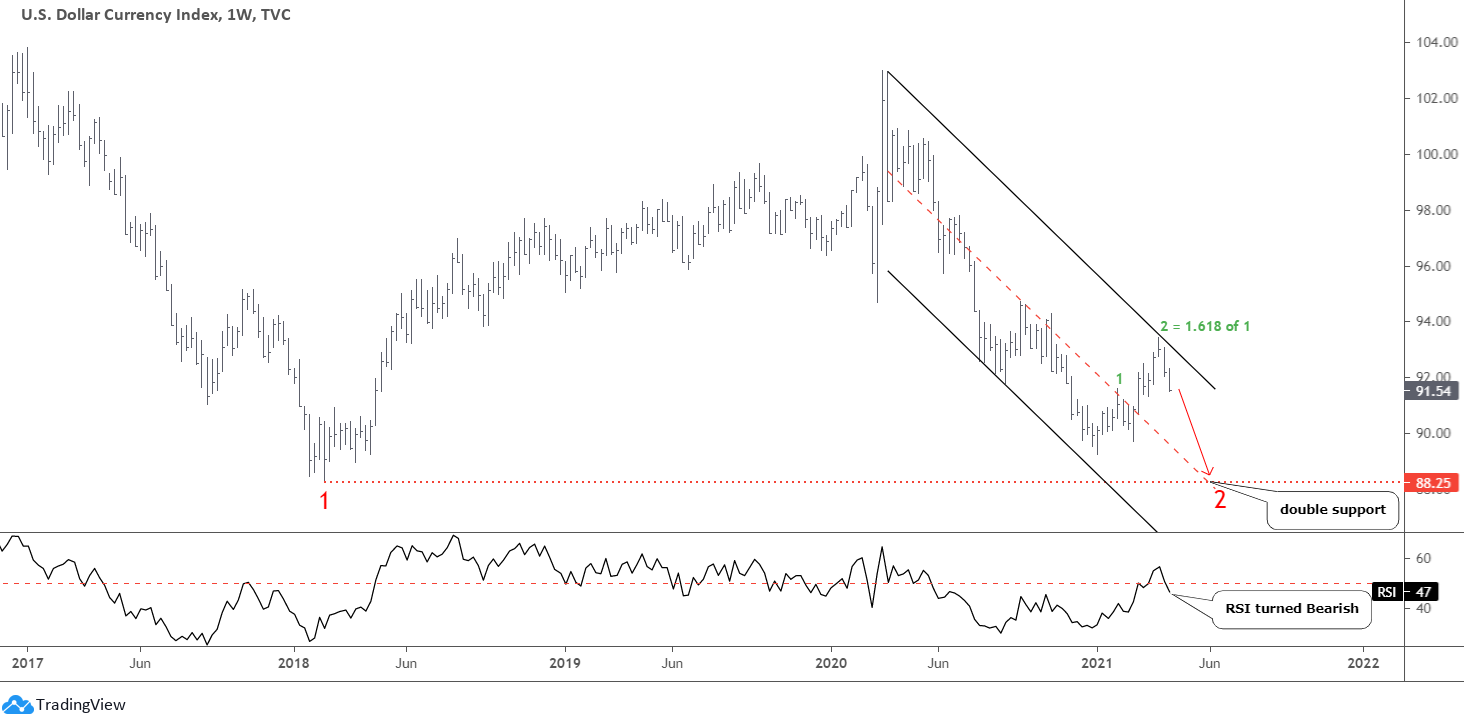
King Dollar Weekly Chart

The green leg 2 of the pullback traveled 1.618 of the distance of the first green leg up and touched 93.44 at the top. Then, the price quickly reversed down to drop like a rock. The last week’s bar closed at the minimum as selling pressure persisted. I switched to a weekly time frame to show you how accurately the current second leg down repeats the path of the first leg down.

This time, after the price went deep down, I built the black downtrend channel through the recent peak. We can see the magic of the trend here as the mid-channel accurately intersects the valley of the first leg down at 88.25 to offer double support for the price.

The RSI turned Bearish following the brief roll over the crucial level. It confirms the downward outlook.

This predictability of the dollar dynamics made me reconsider the gold chart below. Continue reading "Gold & Silver: The Dollar Shows The Way"

Weekly Stock Market Forecast

This week we have a stock market forecast for the week of 4/18/21 from our friend Bo Yoder of the Market Forecasting Academy. Be sure to leave a comment and let us know what you think!

The S&P 500 (SPY)

SPY Daily Chart - Stock Market Forecast

If you were not clear about how directly the impact of the Fed’s expansion of the money supply affects the S&P 500 (analyzed here using SPY), this daily chart will fix that.

The market is levitating into what appears to be a “blow-off top,” as it becomes absurdly overbought.

But don’t fall into the trap… Continue reading "Weekly Stock Market Forecast"
Bitcoin Nears Trigger, AAPL Set To Rally

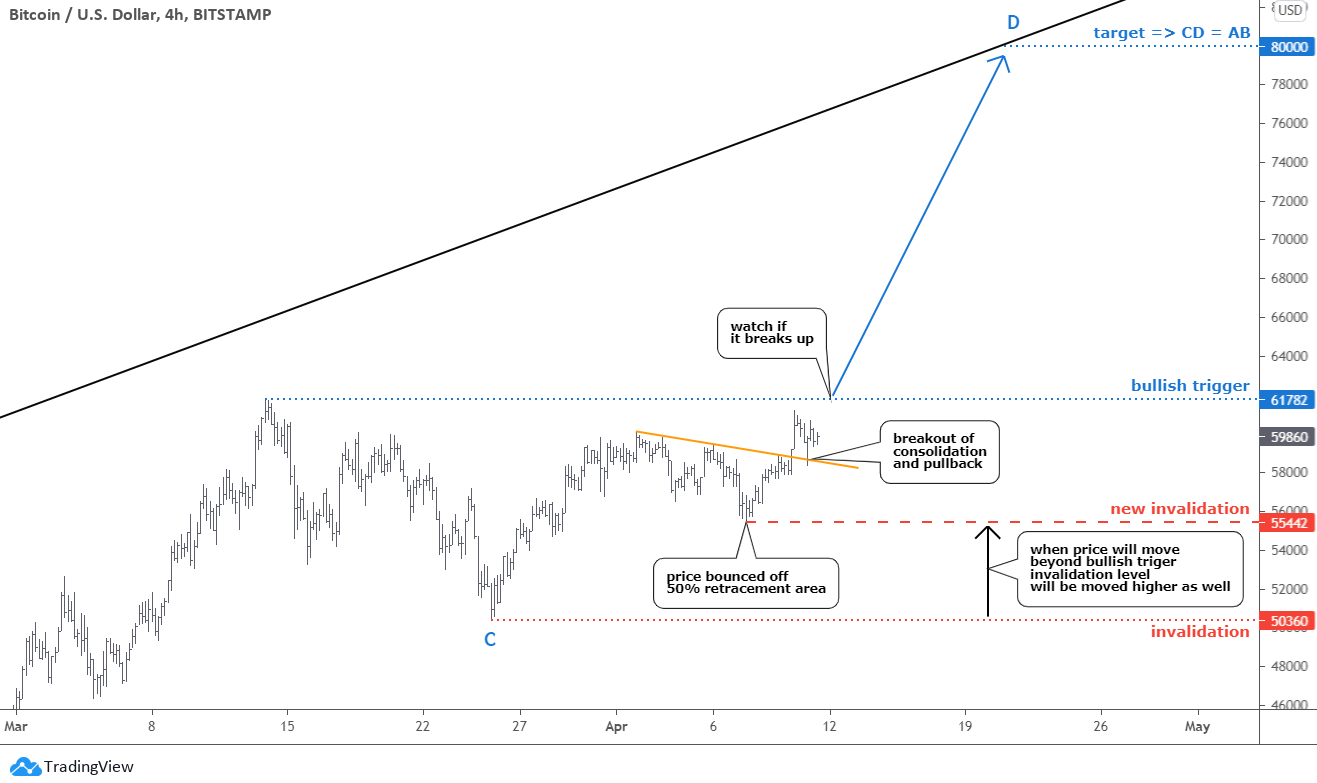
A sleepless Bitcoin moves accurately as per the plan posted last week. The majority of you agreed that the $80k target is achievable for the leading coin. Here is an updated chart below where I zoomed in to a 4-hour time frame to share more details with you.

Bitcoin Price Chart

As I said before, Bitcoin's chart structure builds similarly with conventional trading instruments these days. The forecasted correction reached the 50% Fibonacci retracement level in the $55k area. It stopped there as the price bounced up and hit the orange trendline resistance soon. Continue reading "Bitcoin Nears Trigger, AAPL Set To Rally"

Weekly Stock Market Forecast

This week we have a stock market forecast for the week of 4/11/21 from our friend Bo Yoder of the Market Forecasting Academy. Be sure to leave a comment and let us know what you think!

The S&P 500 (SPY)

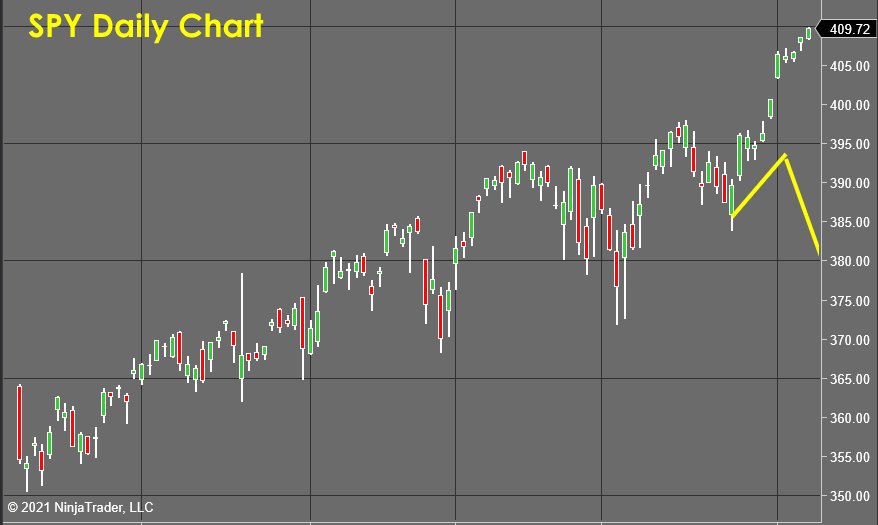
SPY Daily Chart - stock market forecast

The understanding that the Federal Reserve will stop trying to fight and rather accept inflation coupled with the new round of stimulus has caused the S&P 500 (analyzed here using the SPY) to react with a gap up and run type surge.

Initially, the buying wasn’t connecting to an equal surge in internal bullish energy, but that changed later in the week as short squeezes and new longs brought their buying orders to the market. Continue reading "Weekly Stock Market Forecast"