Bonds And Stimulus Are Driving Big Sector Trends

Falling Bonds and rising yields are creating a condition in the global markets where capital is shifting away from Technology, Communication Services and Discretionary stocks have suddenly fallen out of favor, and Financials, Energy, Real Estate, and Metals/Miners are gaining strength. The rise in yields presents an opportunity for Banks and Lenders to profit from increased yield rates. In addition, historically low-interest rates have pushed the Real Estate sector, including commodities towards new highs.

We also note Miners and Metals have shown strong support recently as the US Dollar and Bonds continue to collapse. The way the markets are shifting right now is suggesting that we may be close to a technology peak, similar to the DOT COM peak, where capital rushes away from recently high-flying technology firms into other sectors (such as Banks, Financials, Real Estate, and Energy).

The deep dive in Bonds and the US Dollar aligns with the research we conducted near the end of 2020, which suggested a market peak may set up in late February. We also suggested the markets may continue to trade in a sideways (rounded top) type of structure until late March or early April 2021. Our tools and research help us to make these predictions nearly 4 to 5+ months before the markets attempt to make these moves.

If our research is correct, we may have started a “capital shift” process in mid-February where declining Bonds, rising yields, and the declining US Dollar push traders to re-evaluate continued profit potential in the hottest sectors over the past 6 to 12+ months. This would mean that Technology, Healthcare, Comm Services, and Discretionary sectors may suddenly find themselves on the “not so hot” list soon. Continue reading "Bonds And Stimulus Are Driving Big Sector Trends"

Watch Gold, Leave Silver Alone

It is time to update the charts as gold triggered the former valley of $1765 last Friday.

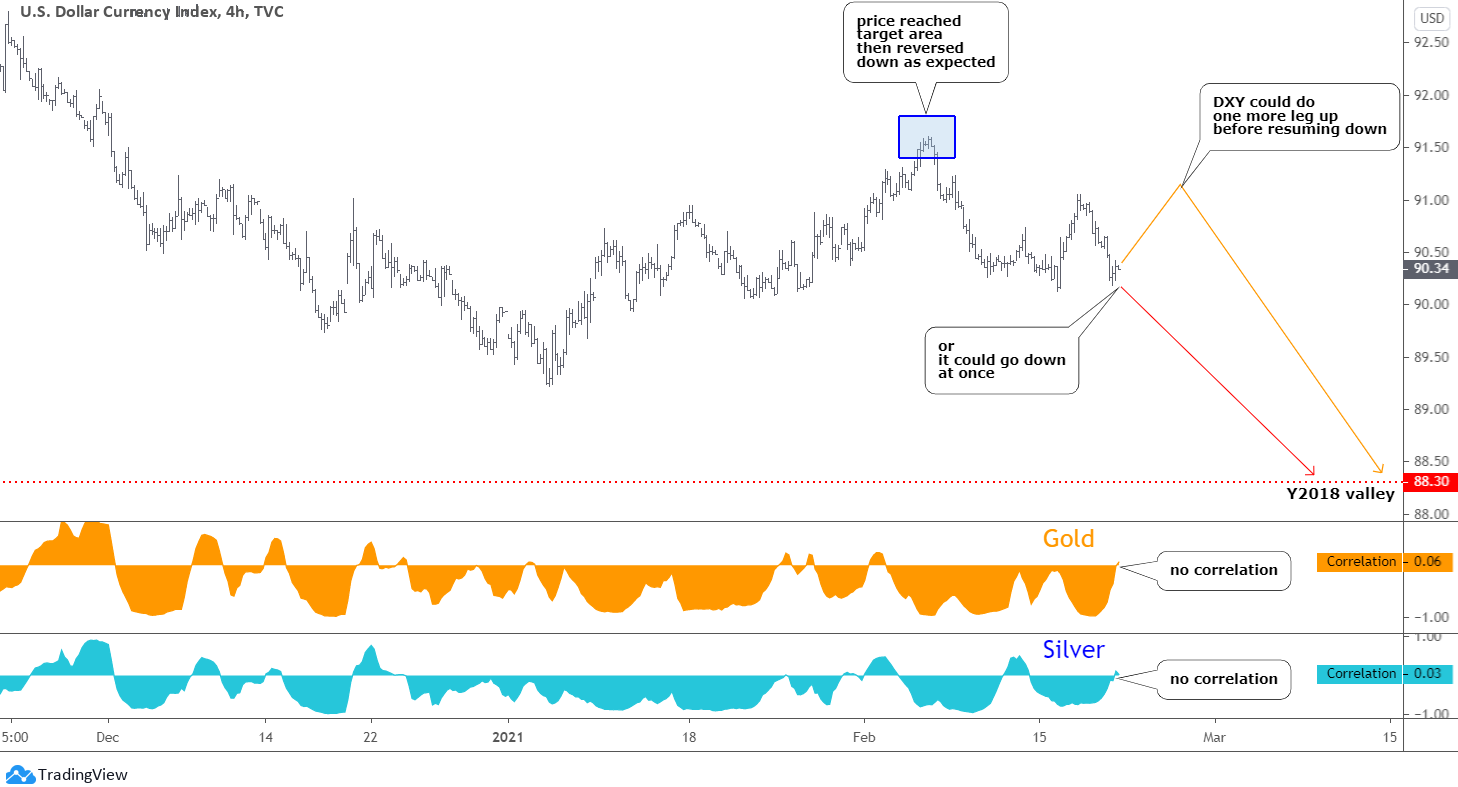
The U.S. dollar index (DXY) opens this post.

Dollar Index

Most of you agreed last month with the plan that the dollar index will extend its consolidation to the upside, making a zigzag first to the downside and then to the upside with the target area between 91.40 and 91.80 (blue box). The former was your favorite goal, and it was hit with a margin as the price reached 91.60 at the top of this month. Continue reading "Watch Gold, Leave Silver Alone"

Gold Could Be Setting Up For A Breakout

There has been quite a bit of chatter related to precious metals lately. The rally in Cryptos, particularly Bitcoin, and various other stocks have raised expectations that Gold and Silver have been overlooked as a true hedging instrument. As these rallies continue in various other stocks and sectors, Gold and Silver have continued to trade sideways over the past 6+ months – when and how will it end?

Gold Support Near $1765 May Become A New Launchpad

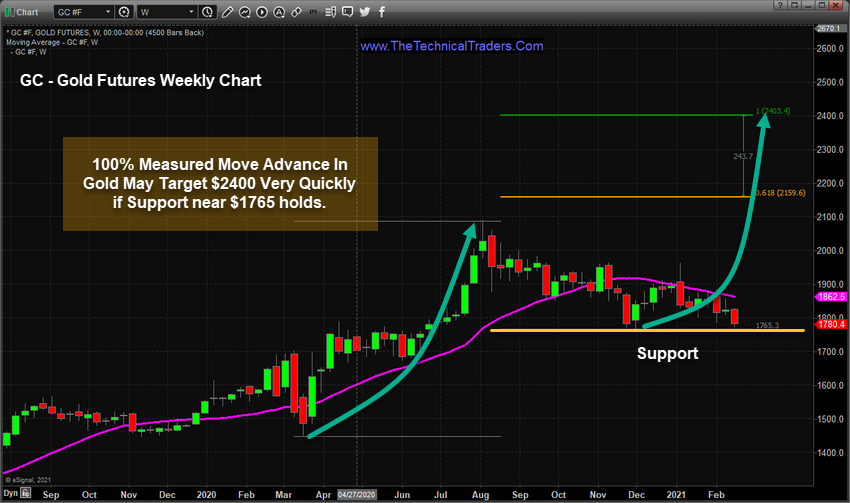
My research team and I believe the recent downside trend in Gold has reached a support level, near $1765, that will act as a launching pad for a potentially big upside price trend. This support level aligns with previous price highs (May 2020 through June 2020) after the Covid-19 price collapse, which we believe is an indication of a strong support level. As you can see from the Gold Futures Weekly chart below, if Gold price levels hold above $1765 then we feel the next upside rally in metals could prompt a move targeting $2160, then $2400.

Gold

The February 2021 Gold contract expires on February 24 – only a few days away. The CME Delivery Report shows an incredible amount of contracts already giving notice of a “Delivery Request”. This suggests that on or near February 25, a supply squeeze for Gold and Silver may become a very real component of price. Continue reading "Gold Could Be Setting Up For A Breakout"

Gold & Gold Stock Corrections Are Normal

Corrections in Gold and Gold Stocks are completely normal in an inflationary macro market phase.

Every week I notice the agony ratcheting up incrementally. While the rest of the casino takes off to the speculative heavens, gold sits on its heavy ass and the gold miners go nowhere in a downward-biased perma-correction. Or so it seems. It’s all normal and I’ll explain why.

First of all, it is not healthy to be railing against unseen nefarious manipulative interests. That is emotion and emotion has to be kept out of it (and yes, I get as aggravated as the next guy sometimes, but it cannot affect your plan or you will be the victim, the mark). You have to take what the market gives you and roll with it. All markets are manipulated when you consider that the greatest manipulation of all is courtesy of the Federal Reserve, implementing it's MMT (Modern Monetary Theory), err, that is TMM (Total Market Manipulation) toward desired ends.

The primary tool in that manipulation is inflation. The oldest trick in the Fed’s book. But they can only inflate under cover of a deflationary macro and the 2020 COVID-crash made that the story and as yet it’s a condition that keeps on giving license to the inflators. But very likely sometime in 2021, our indicators will signal a failure into another deflationary liquidation or a more intense inflationary problem, neither of which would be positive for the economy. Continue reading "Gold & Gold Stock Corrections Are Normal"

Treasury Yields Suggest A Top Is Near

Historically, whenever the Treasury Yields fall below zero, then recover back above zero, the US/Global markets reach some peak in price levels within 3 to 8+ months. My research team and I believe the actions of the global markets may be setting up for a future peak in price levels sometime in the next 6 months. We believe this will start when the Treasury Yields cross above the “Breakdown Threshold”.

Expect a continued rally as long as yields stay below certain levels.

In 1998, a very brief drop below zero in yields prompted a minor pullback in the markets before the bigger top setup in 2000. This pullback in price aligned with what we are calling the “Breakdown Threshold” level on Yields near 1.20. After the Yields crossed this Threshold, briefly, in 1999, they fell back below this level and the US stock market continued to rally toward an ultimate peak in 2000.

In late 2000, Yields collapsed well below the zero levels and recovered back above zero in early 2001. Just 3+ months later, Yields had rallied above the Breakdown Threshold level (1.2) and the US stock markets had already begun to breakdown as well. This instance, the 2000-01 peak, took place after an Appreciation cycle phase prompted an Excess Phase Rally (the DOT COM bubble). The “Rollover Top” that took place near this top may be similar to what we see happen in 2021 if our research is correct. Continue reading "Treasury Yields Suggest A Top Is Near"