U.S. Crude Production Growth Stalled In April

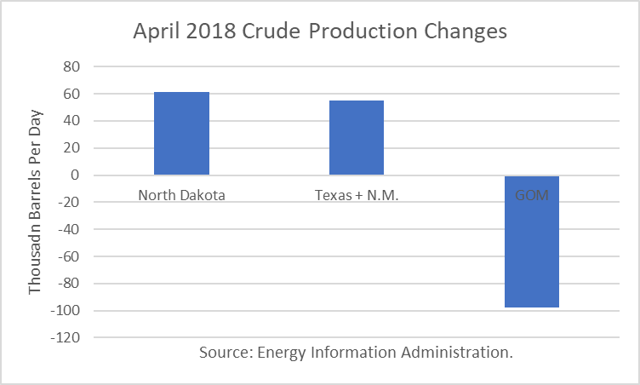
The Energy Information Administration reported that April crude oil production averaged 10.467 million barrels per day (mmbd), off 2,000 b/d from March’s all-time record high for the U.S. The small but unexpected decline was due to unplanned maintenance in the Gulf of Mexico (GOM), which reduced production there by 98,000 b/d. Otherwise, healthy increases were recorded in North Dakota (61,000 b/d) and Texas + New Mexico (55,000 b/d).
LLLL

The EIA-914 Petroleum Supply Monthly (PSM) figure was 115,000 b/d lower than the weekly data reported by EIA in the Weekly Petroleum Supply Report (WPSR), averaged over the month, of 10.582 mmbd. EIA’s most recent weekly estimate for the week ending June 22nd was 10.900 mmbd. Continue reading "U.S. Crude Production Growth Stalled In April"

Oil and Gas ETFs Are Having a Good 2018

Thus far in 2018, the oil and gas industry has been booming. Rig counts in the US are up, prices at the pump are up, and the oil and gas ETFs tracking the sector are up by a lot.

Investors who have been following the industry over the past year could have made some serious money as a few of the leveraged ETFs are up 238% or more. The Velocity Shares 3X Long Crude Oil ETN (UWT) is up 247% over the last 12 months and is up more than 70% year-to-date. The UBS ETRACS ProShares Daily 3X Long Crude ETN (WTIU) has risen 240% over the last year and 64% year-to-date. Finally, the Proshares UltraPro 3X Crude Oil ETF (OILU) is up 238% over the last 12 months and 63% year-to-date.

But, perhaps your less risky and don’t like investing in the leveraged ETFs? Well, you still could have done well as the United States Brent Oil Fund LP (BNO) is up 71% over the last year and 19.9% since the start of 2018. Or perhaps you went with the ProShares K-1 Free Crude Oil Strategy ETF (OILK) which is up 62% in the past 12 months and 23% year-to-date. Or either the iPath Series B S&P GSCI Crude Oil ETN (OILB) or the United States Oil Fund LP (USO) which are both up more than 61% over the last year and 23% year-to-date.

There have been some reasons why the industry has been on a tear over the last, and many of that reason don’t show signs of changing in the short term. OPEC is committed to increasing the price of oil (despite its recent modest increase in production), smaller US outfits still need slightly higher prices before they can add additional rigs and become profitable, the economy appears to be healthy and growing, US consumers have not yet begun to fell the “pain at the pump” again really. Continue reading "Oil and Gas ETFs Are Having a Good 2018"

Oil Price Implications Of OPEC's New Oil Deal

OPEC concluded its meeting on June 22nd with a vaguely-worded communique about its oil deal:

“Accordingly, the Conference hereby decided that countries will strive to adhere to the overall conformity level of OPEC-12, down to 100%, as of 1 July 2018 for the remaining duration of the above-mentioned resolution and for the JMMC to monitor and report back to the President of the Conference.”

At the press conference afterward, OPEC president HE Suhail Mohamed Al Mazrouei, UAE Minister of Energy and Industry, struggled to explain exactly what it meant. When asked how many barrels would be added, he remarked that “you can do the math” between current output and the 100 percent conformity level, although he later said it was about one million barrels per day.

However, at the press conference of the 4th OPEC and non-OPEC Ministerial Meeting on June 23rd, oil ministers Khalid al-Falih of Saudi Arabia and Alexander Novak of Russia, responded to questions, explaining the new deal and how it would be implemented.

But Iran’s oil minister later said that OPEC’s oil output agreement did not specify a production increase, which probably explains why the agreement was left vague. It also explains Mr. Al-Falih’s unusual remark at the press conference: Continue reading "Oil Price Implications Of OPEC's New Oil Deal"

Global Supply/Demand Oil Outlook

Robert Boslego - INO.com Contributor - Energies - Oil Outlook


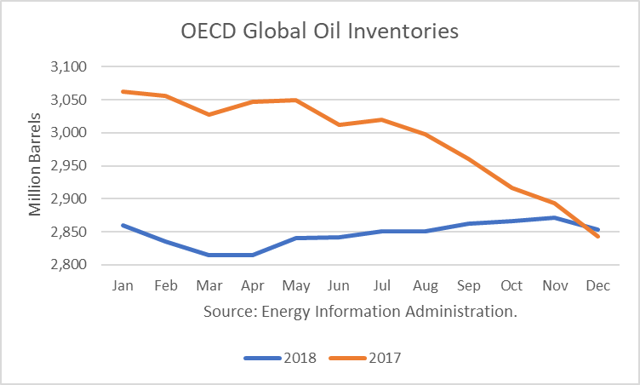
The Energy Information Administration updated its global supply/demand oil outlook for June. It shows total OECD oil inventories rising through November, ending the year about where they were last December.

Oil Outlook

This is in contrast to the rapid decline in stocks over the second half of 2017, and that enabled oil prices to rise. If this forecast is realized, it should have a moderating impact on prices, taking away some of the risk premium embedded in futures prices.

The stock projections are based on a number of assumptions: Continue reading "Global Supply/Demand Oil Outlook"

U.S. March Crude Production Shows Large Gain

Robert Boslego - INO.com Contributor - Energies - U.S. March Crude Production


The Energy Information Administration (EIA) reported that February crude oil production averaged 10.474 million barrels per day (mmbd), up 215,000 b/d from February, setting a new all-time record for the U.S. The large increase was on top of a 264,000 b/d gain in February.

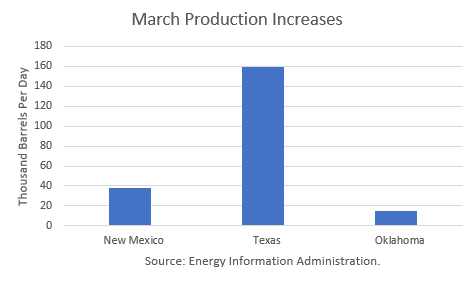
The largest increases were recorded in Texas (159,000 b/d), New Mexico (38,000 b/d) and Oklahoma (15,000 b/d).

U.S. March Crude Production

The EIA-914 Petroleum Supply Monthly (PSM) figure was 54,000 b/d higher than the weekly data reported by EIA in the Weekly Petroleum Supply Report (WPSR), averaged over the month, of 10.420 mmbd. EIA’s most recent weekly estimate for the week ending May 25th was 10.769 mmbd. Continue reading "U.S. March Crude Production Shows Large Gain"