Today's guest blogger comes from the popular MYSMP.com site and it's creator Kunal Vakil. Kunal is a man who is plugged into the market literally!! I asked him to give his unique perspective on the market...and it's symmetry.
===========================================================
First off, I want to thank Adam and Trader's Blog for allowing me to post my materials on Trader's blog.
Today, I want to share my thoughts on the S&P 500 and where I see it heading before this bear market is over. And, yes, we are in a bear market. Not only has the Dow Jones already fallen 20% off its highs of last year with the S&P 500 nearly there as well, but the price action in the broad markets has been that of a bear market. It is typical to see sharp sell-offs and ferocious bear market rallies which make even the bears capitulate, all before the market begins a move lower again. Big volume down, and low volume up. This is precisely what we have seen since the top at 1576.09 on the S&P back in October of 2007.
Now, let's talk about the culprit a little. We know that the banking index has been decimated with the exacerbating write-downs and credit quality issues due to the unscrupulous practices of many bankers and loan brokers. Many banks have lost over 50% of their value, and the beating continues. As we review the daily charts of the major banks, one can easily see a pattern that is definitive of a bear market, lower highs and lower lows. From looking at these charts, it is my firm opinion that the worst is not over yet. We are probably half way through the write-down cycle. Now what does this mean for us as traders?
Well, here is what I am watching very carefully. I want to see some of the major banks (ie. C, LEH, MER, MS, GS, FNM, FRE) start to show signs of strength relative to the entire market. I want to start seeing them make higher lows and higher highs. I want to see a base building process develop within these stocks. I want to see volume lighten up to the downside and increase to the upside. When these developments start to take place, we can start to look for long entries in these stocks. Is the US banking sector going to fall to 0? NO!, but don't try and catch a falling knife, stay patient. Remember, Cheap can always get cheaper...and it has.
Moving back to the S&P 500, I want to now walk you through a few charts that will illustrate where I think this market is headed by the Sept./October timeframe. This period historically provides some dynamite buying opportunities and it looks like this year wont disappoint.
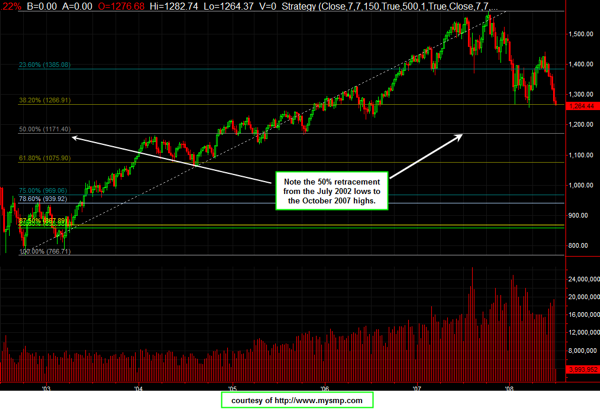
On longer term charts, especially index charts, Fibonacci retracements and extensions offer good points of support and resistance. Here you can see that the S&P has a major support area at the 1171 area. I will show you why this is a very important level.
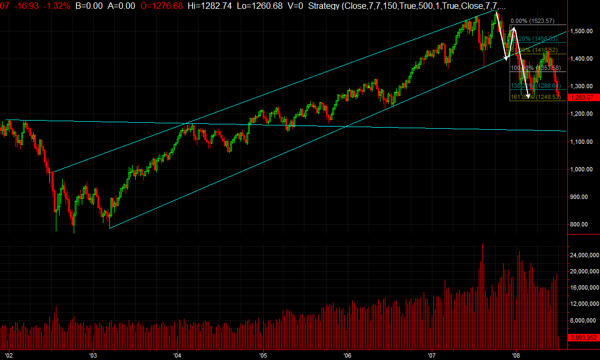
Our next chart is another weekly chart of the S&P, however, this time notice the Fibonacci extension. Notice the initial move off the top and the subsequent rally off that reaction low created an extension target between 1353 to 1248. Notice how the 1.382 and 1.618 levels held the two lows set in January and March and the market showed its weakness by extending down to the lower end of that zone.
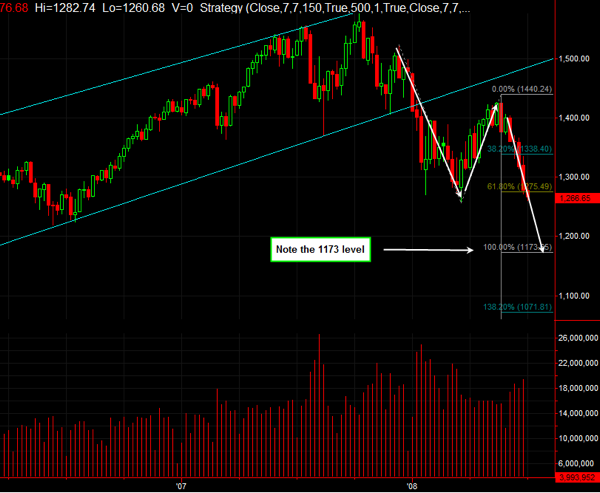
The next chart shows you the current extension that we are watching now. It starts with the December 2007 highs going down to the March lows and the retracement up is at the May highs around 1440. Now, notice the extension targets. The 100% extension takes us down to 1173.65, very close to the 50% Fibonacci retracement level in our first chart.
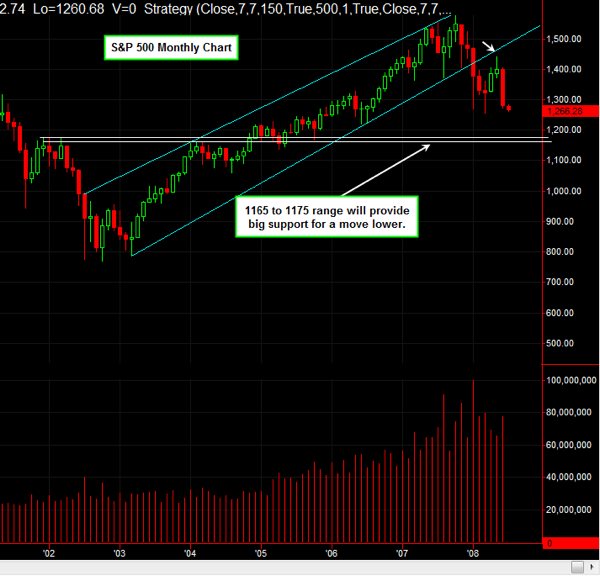
One final point in terms of symmetry that I want to make here. Back in 2003 when we were looking for a breakout in this market, the 1165 to 1175 range was a key pivotal area we watched. It represented the neckline of a massive W bottom, which some would call an inverted head and shoulders. This area is going to provide massive support on the way down.
All things considered, I am looking for another 100 point drop in this index before I can see a true bottom being put in. Remember, you want to watch the leaders on the way up and the way down. The banks have been providing that leadership and are showing no signs of letting up. Therefore, we are not bottom picking here. The speculative soul in me believes that the shoe is going to drop with one of the big banks out there. Time will tell but until then, be safe and protect your downside risk.
All the best,
Kunal Vakil
MYSMP.com


 A few weeks ago we introduced you to a friend of INO's, Aamar Shehzad. Today he's going to give our readers a tool that everyone can use daily to improve their trading.