Gold, Silver, Gold/Silver Ratio & HUI

Precious metals are still locked down. With an understanding that there is always much more in play than nominal charts (the macro & sector fundamentals for example, which bounced of late but never did definitively flip positive), let’s review said nominal charts of gold, silver, and HUI along with an update of the Gold/Silver ratio for good measure.

Meanwhile, we will continue to update the full spectrum of considerations for a positive view of the precious metals complex, including gold’s standing vs. cyclical, risk-on markets/assets, the state of speculative vs. quality credit spreads, the inflationary backdrop (despite promotions to the contrary, cyclical inflation is not beneficial to the gold mining industry), the seasonal averages and the charts of the metals and miners over various time frames in NFTRH.

Gold

The daily chart shows the gold price (futures) below the moving averages but above short-term support after failing – amid much personally observed cheerleading to the contrary – to cross the bull gateway at 1920.

As a side note, the broken blue downtrend channel on this daily chart is actually the Handle to a large and bullish big picture Cup that only has one thing going against it that I can see; too much exposure by too many TAs, which of course means it may not be expressed until many of those TAs recant their stories (we have noted all along that the Handle can drop all the way to the 1500s without damaging the 2022 bullish Cup story. Indeed, if it were to happen (not predicting folks, but being prepared) it would be healthy. There is nothing healthier than a good running of the bugs before a major bull move. Continue reading "Gold, Silver, Gold/Silver Ratio & HUI"

Gold; A Thing Of Beauty...

Gold calmly continues cobbling its Handle; Miners lay in wait.

You see, there is all this noise out there. It comes mostly from inflationists touting gold in the same breath as copper, as oil, and as commodities of all flavors (and aside from gold and, to a degree, silver, those flavors are cyclical).

But you also see, gold is counter-cyclical in its best suit. You see on this monthly chart that gold has been forming its Handle to the bullish Cup ever since the inflation trades came to the fore in the summer of 2020. Therefore, you see that those touting gold and inflation together have been wrong for over a year now (and counting).

For those dealing in reality instead of dogma, gold is a candidate to break the Handle at any time. Then it would be off to the target at 3000+ over the course of a year or more. But reality holds another option as well, and that is to finish the Handle making lower.

So why not tune out the perma-pompoms in real-time, realize that the thing is bullish, but the trigger is either coming sooner or later? We are doing that more focused work in NFTRH and associated updates every week and will be on the spot when the proper signals engage.

This chart was created in 2020 as gold spiked to an all-time high and reversed (into the then-projected Handle). Continue reading "Gold; A Thing Of Beauty..."

Is Gold Poised To Move Higher?

Polls show that you were optimistic about the probability of another rally for top metals. Both of them go well with the maps that I shared earlier this month. Let's see, in the updated charts below if they are going to justify your bold expectations.

Gold is the first as it has a stronger position now.

Gold
Chart courtesy of tradingview.com

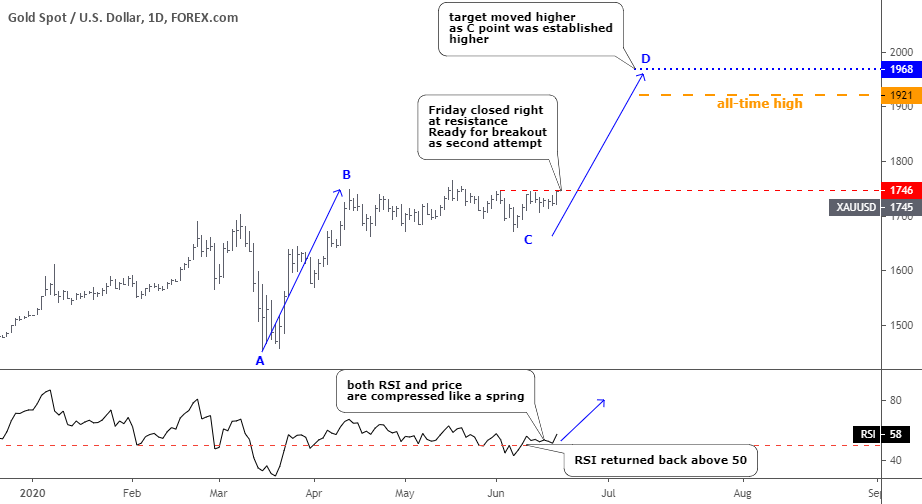
The top metal completed the sideways consolidation that I showed you two weeks ago. It didn't touch the 38.2% Fibonacci retracement level at $1636 as it stopped at $1671, which is even higher than the first leg of this corrective structure, which was established at $1661. It is an entirely natural outcome as the last leg down started at $1766, also higher than the top of the first leg did at $1748. The second leg down was longer ($95) than the first leg ($87). Continue reading "Is Gold Poised To Move Higher?"

Gold Falls As Silver Misses Target

Both top metals couldn’t sustain the growth, although silver was more convincing than gold this time again.

Let’s start with the updated gold chart below.

gold
Chart courtesy of tradingview.com

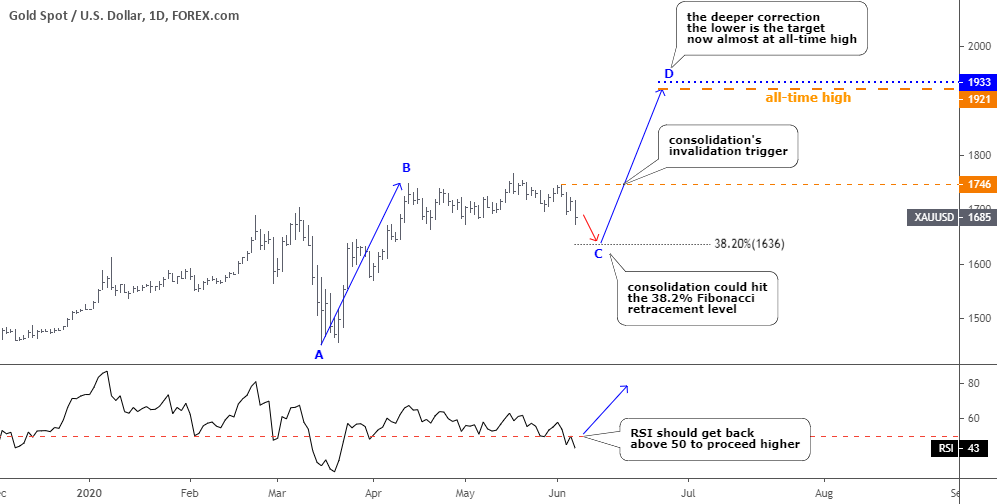
Gold is still consolidating as it couldn’t overcome not only the nearest peak of $1766 but it also failed right at the top of the AB segment of $1748. The RSI dipped into the bearish zone below the crucial 50 level. So, it’s the right time to put our classic instrument called Fibonacci retracement level as gold watches ground while both feet are in the air. The first important 38.2% Fibonacci retracement level could offer support at $1636. Continue reading "Gold Falls As Silver Misses Target"

Are Palladium, Gold And Silver Set To Takeoff?

In this post, I'll go over the charts for palladium, gold and silver, but first I would like to start with palladium futures as it has the most potential gain to reach this round. At the start of May, I shared with you the map with equal opportunities for this champion metal to either break up or down. Here is how you saw the future for palladium in the graph below.

Palladium Poll

The majority chose the “break down” option, although with a minor advantage, but this bet played out as the metal’s price dipped one more time in the third leg down of a large correction. You were right again!

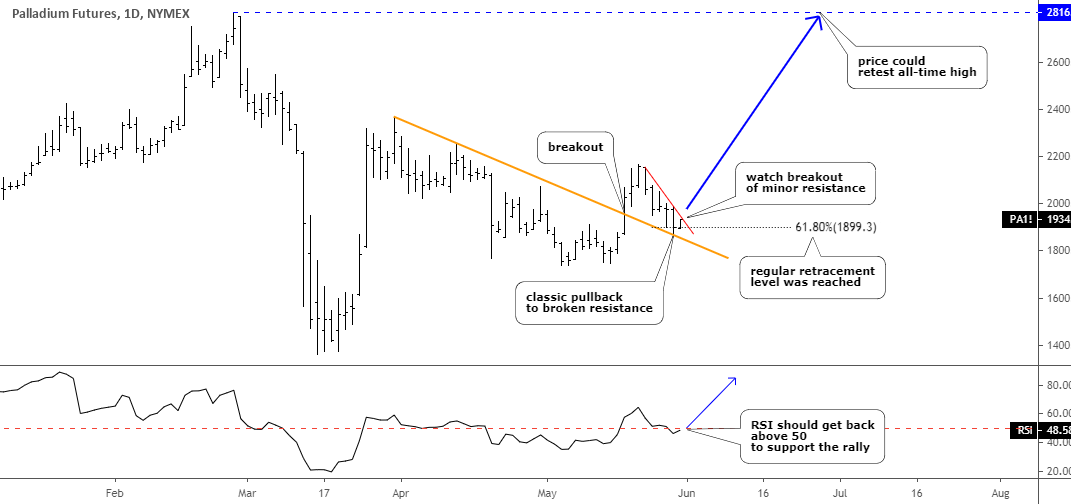
Now, let’s get down to the hot opportunity that I spotted for you on the palladium futures daily chart as it’s worth watching on the Gold & Silver Primetime.

Palladium Gold Silver
Chart courtesy of tradingview.com

The chart structure of palladium futures on the daily time frame could indeed be posted in the trading textbook as it is neat and smooth. I put detailed explanations here and on the chart as this metal gives such an excellent opportunity for education. Continue reading "Are Palladium, Gold And Silver Set To Takeoff?"